Earlier in the year, we announced the availability of MongoDB Charts Beta, the fastest and easiest way to build visualizations of MongoDB data. Today at Mongodb.local San Francisco, we are excited to announce that an update to the beta is now available and integrated into MongoDB Atlas, our hosted database as a service platform. This means that Atlas users can now visualize their data and share with their team, without the need to install or maintain any servers or tools.
Getting started with MongoDB Charts in Atlas couldn’t be simpler. After logging into Atlas, select the Project with the clusters containing the data you want to visualize and click the Charts link in the left navigation bar. After a one-time step to activate Charts, you will be ready to start charting!

If you’ve used MongoDB Charts before, the new Atlas-integrated version will be instantly familiar. The main difference is that you can easily add data sources from any Atlas clusters in your project without needing to enter a connection URI. You’re also freed from the burden of managing users separately, with all Atlas Project members able to access Charts with their existing Atlas credentials provided they have Data Access Read Only role or higher.

We’ve also been busy adding some of the most requested features to the charting experience. Charts has always been great at handling MongoDB’s flexible schema, allowing you to build charts from document-based data that contains nested documents or arrays. In this latest release, we’ve added a number of options for chart authors to customize their charts, including changing axis titles, colors, date formats and more.

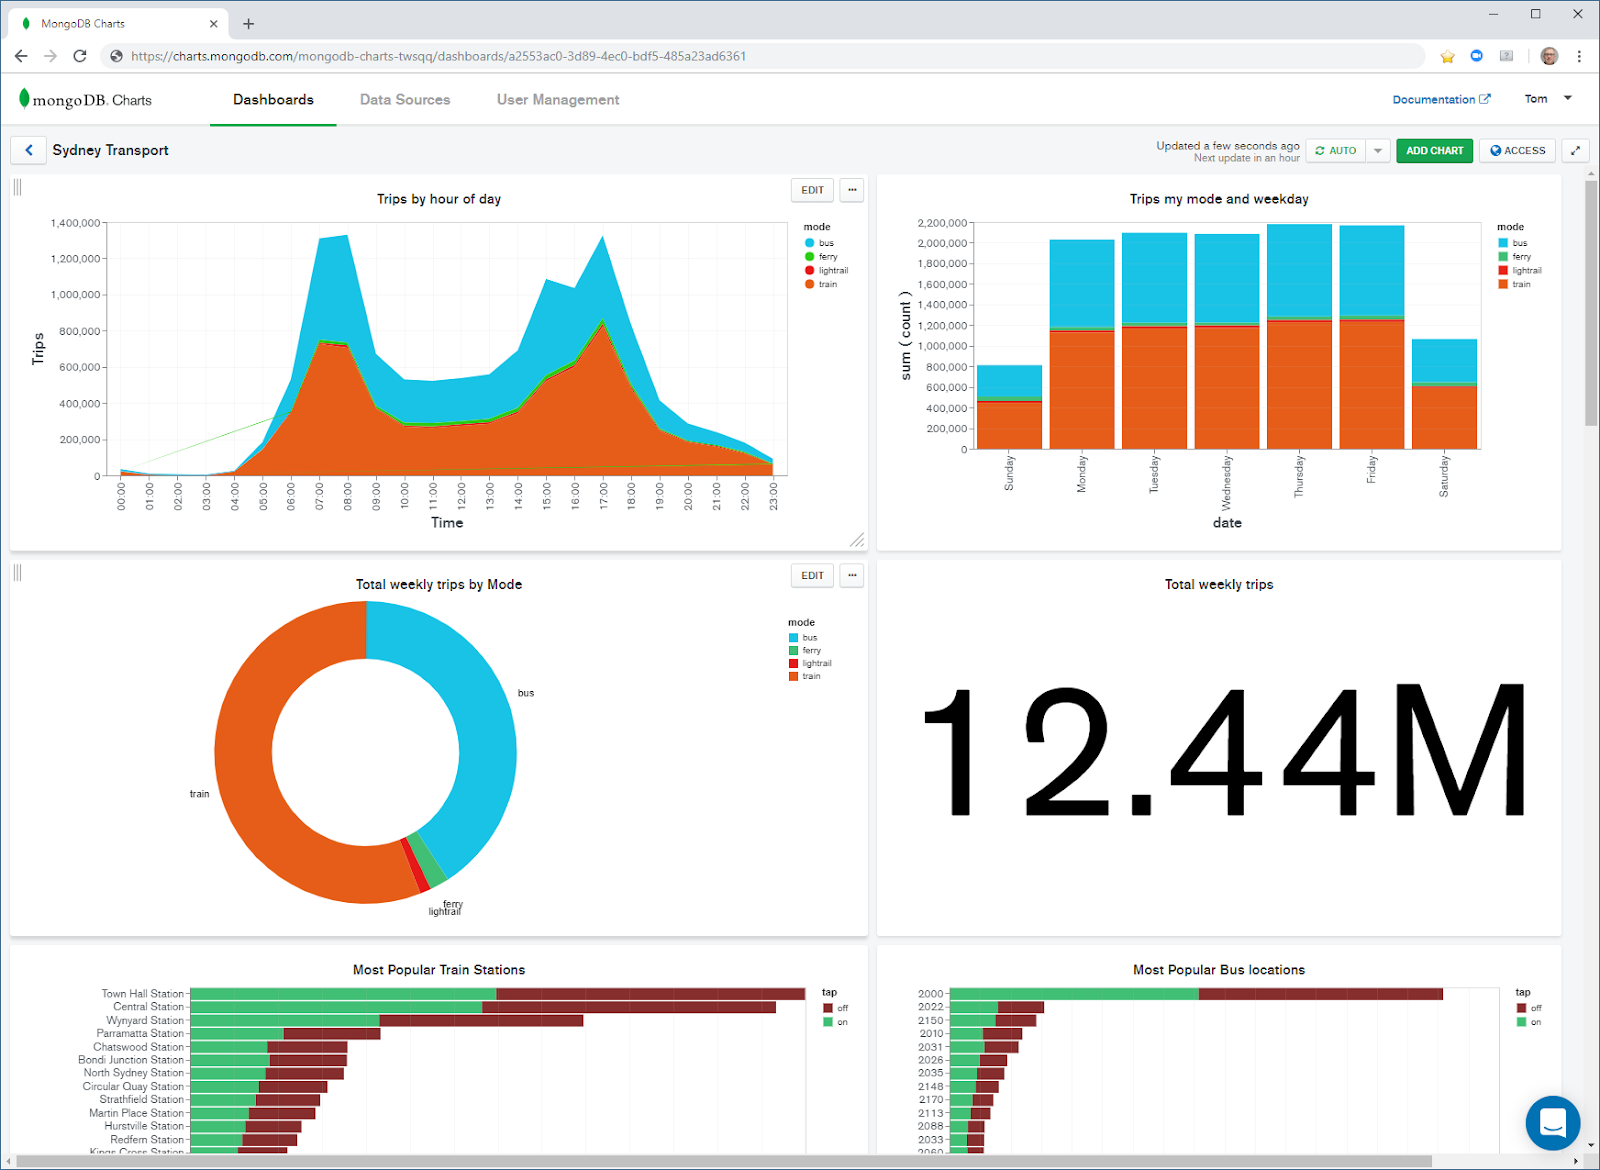
After you’ve created a few charts, you can arrange them on a dashboard to get all of the information you need at a glance. Dashboards can be kept private, shared with selected individuals, or with everyone in your project team.

If you’re not currently using Atlas, we haven’t forgotten about you. MongoDB Charts Beta is also still available to install into your own server environment, allowing you to visualize data from any MongoDB server. We’ll be refreshing the on-premises beta to include the same charting enhancements as seen in the new Atlas version over the coming weeks.
We hope you enjoy this update and that it helps you get the insight you need from your data. If you have any questions or feature requests, you can always send a note to the Charts team by clicking the support button on the bottom of every page.
Happy Charting!