Ops Manager 3.4, released at the beginning of December, contains both new features and changes from the previous major release, 2.0. This blog post will focus on the new Ops Manager 3.4 UI. It will cover new features and highlight changes from the previous UI.
Deployment Page
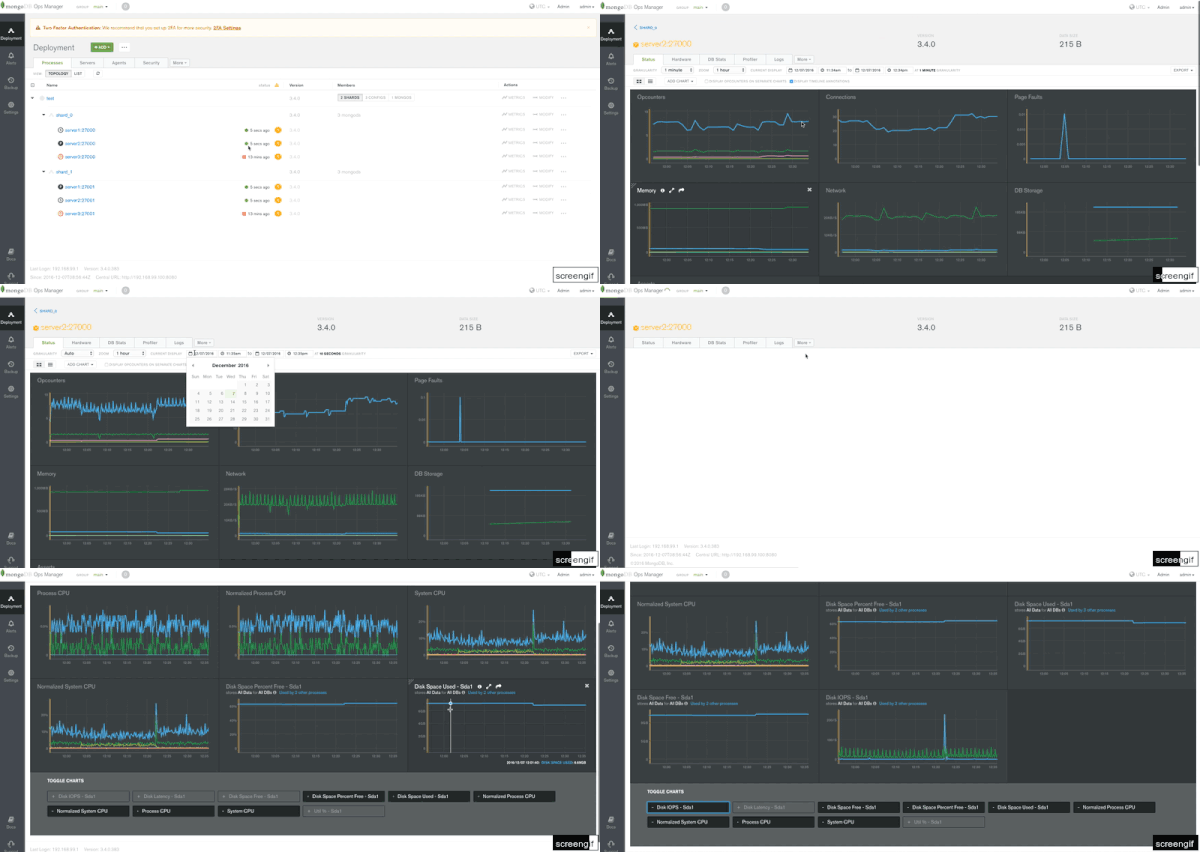
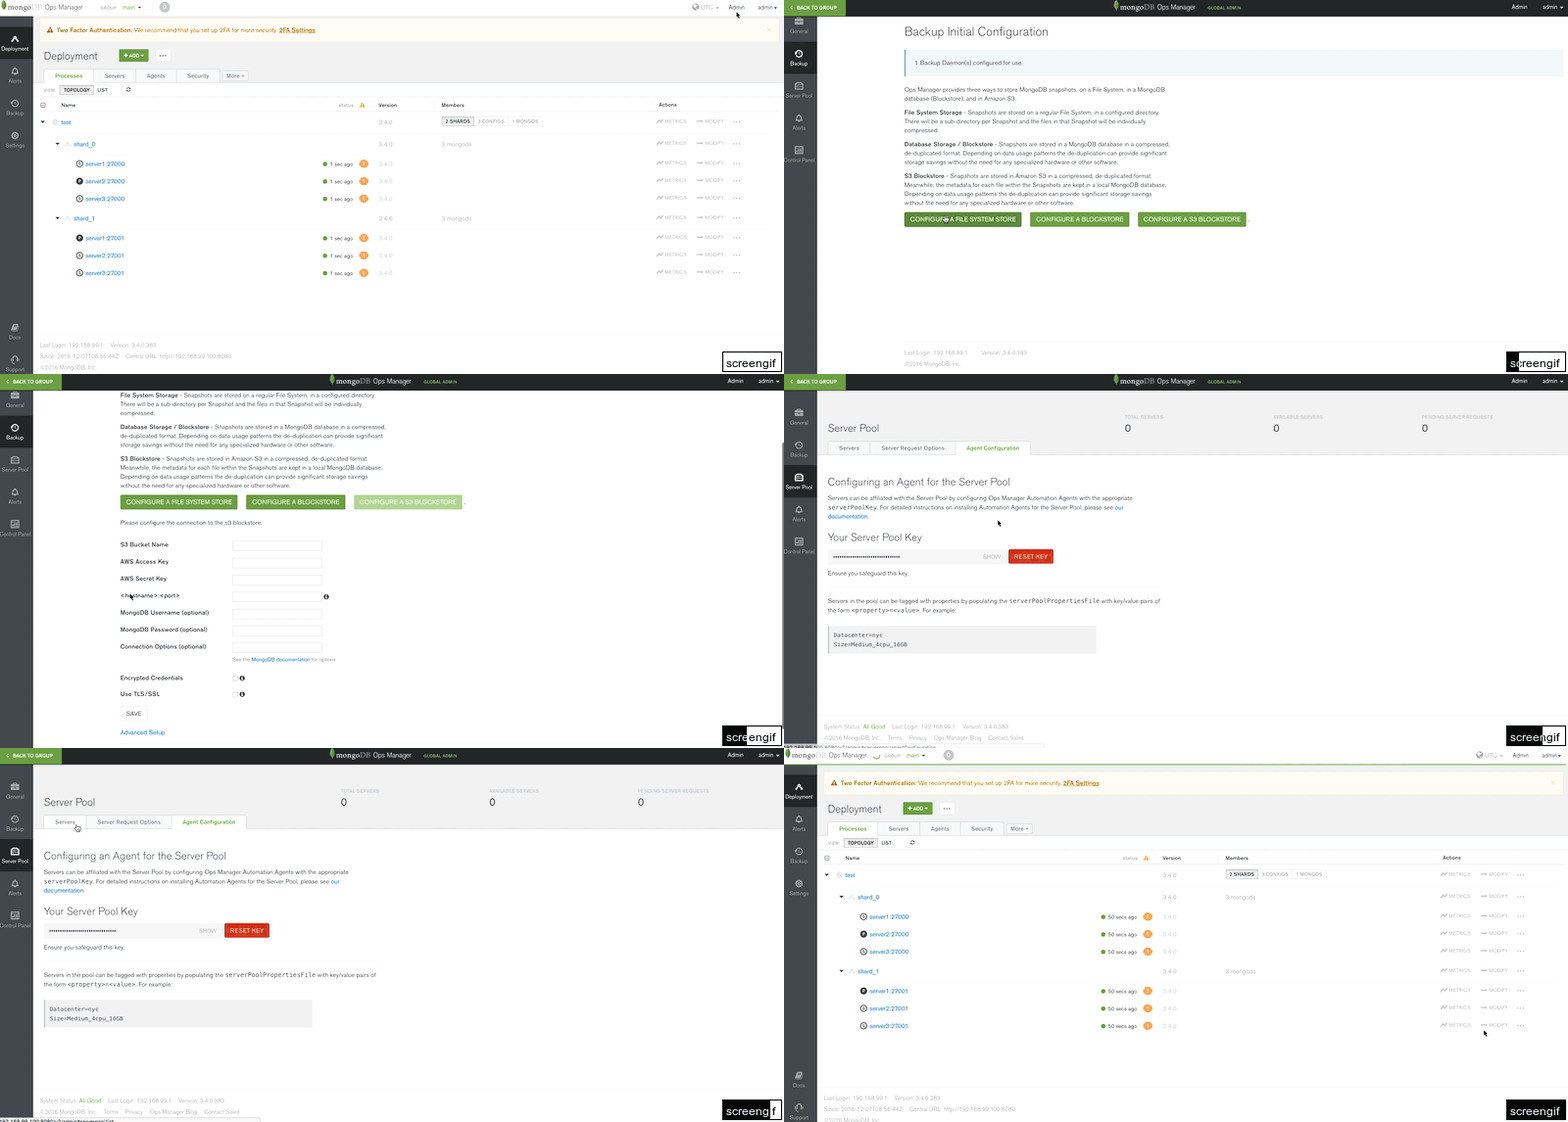
Ops Manager 3.4 has a redesigned deployment page. Items that previously appeared in the inner left-hand navigation bar now appear as tabs. Joining the existing tab for Processes are tabs for Servers and Agents. Security settings also now appear under a separate Security tab. These include USERS, ROLES and AUTHORIZATION & TSL/SSL SETTINGS. The TOPOLOGY and LIST views are now accessed via buttons. Additional functions are accessible under More: Host Mappings, Version Manager, and Logs.
Alerts Tab
Ops Manager 2.0 featured dedicated icons on the top of page showing the health of the agents.
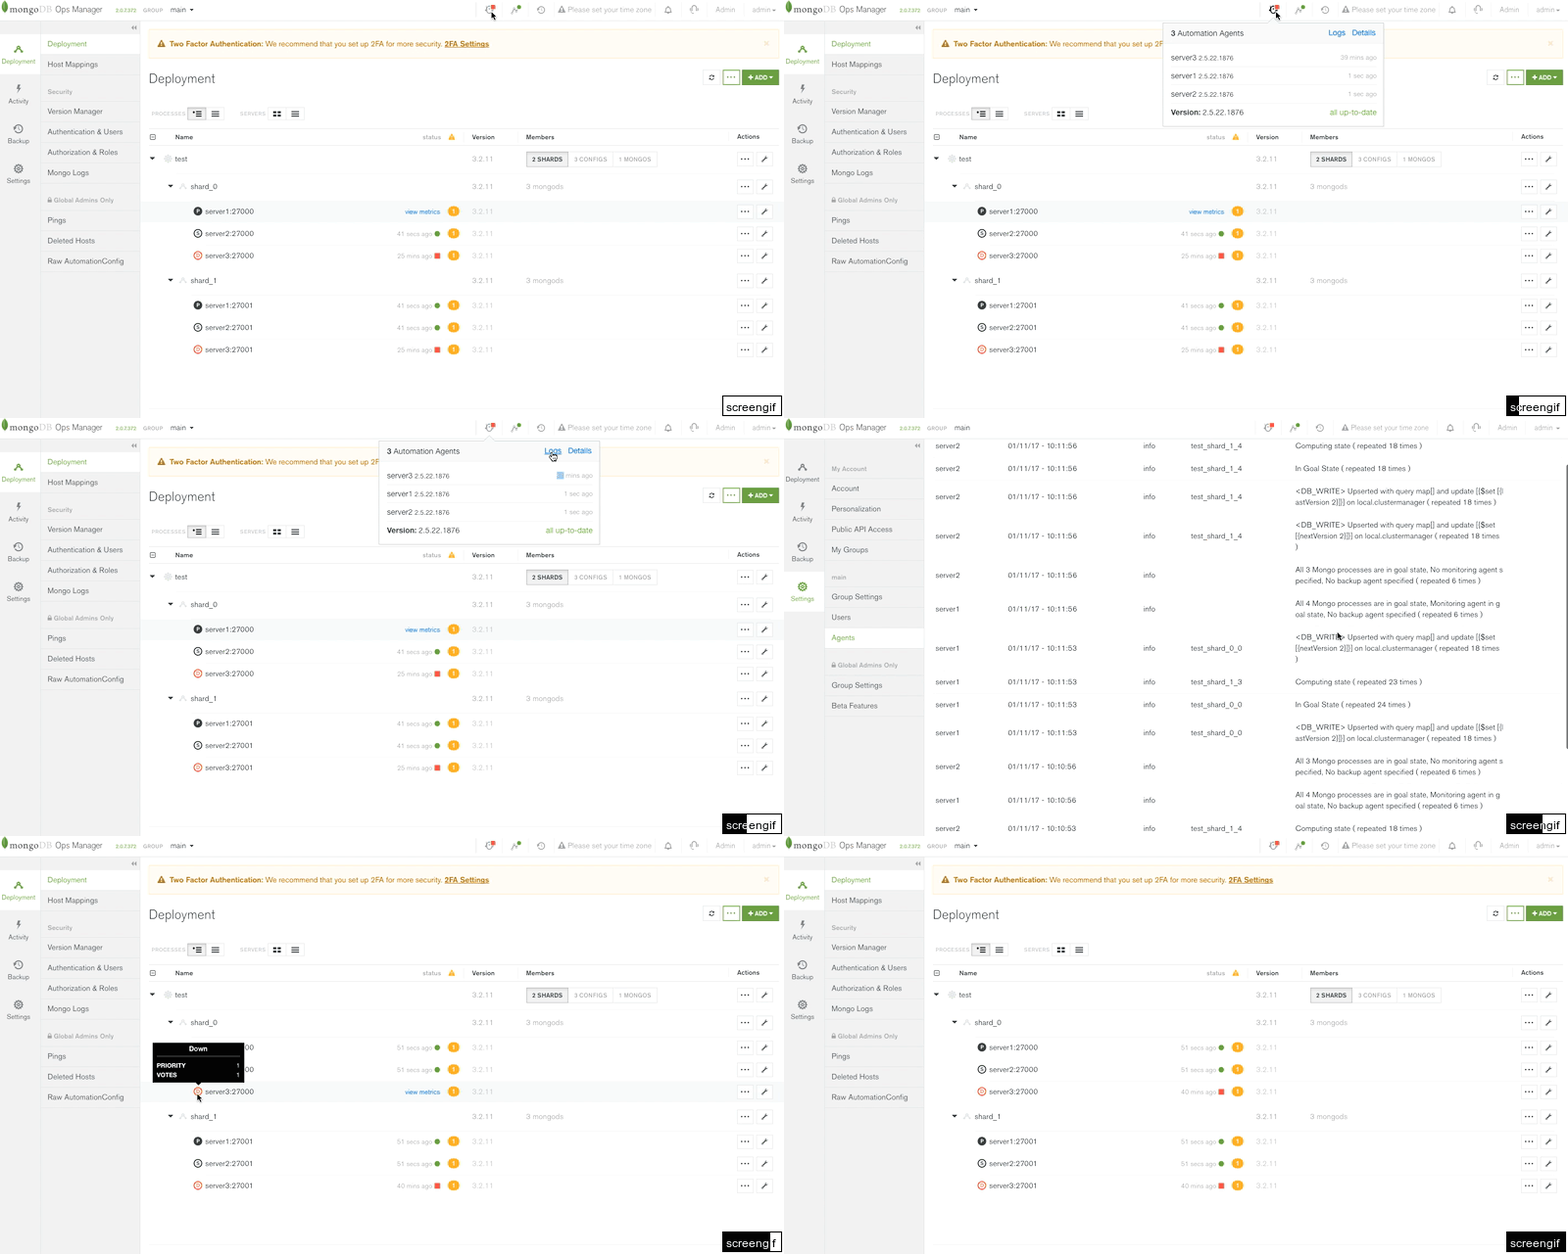
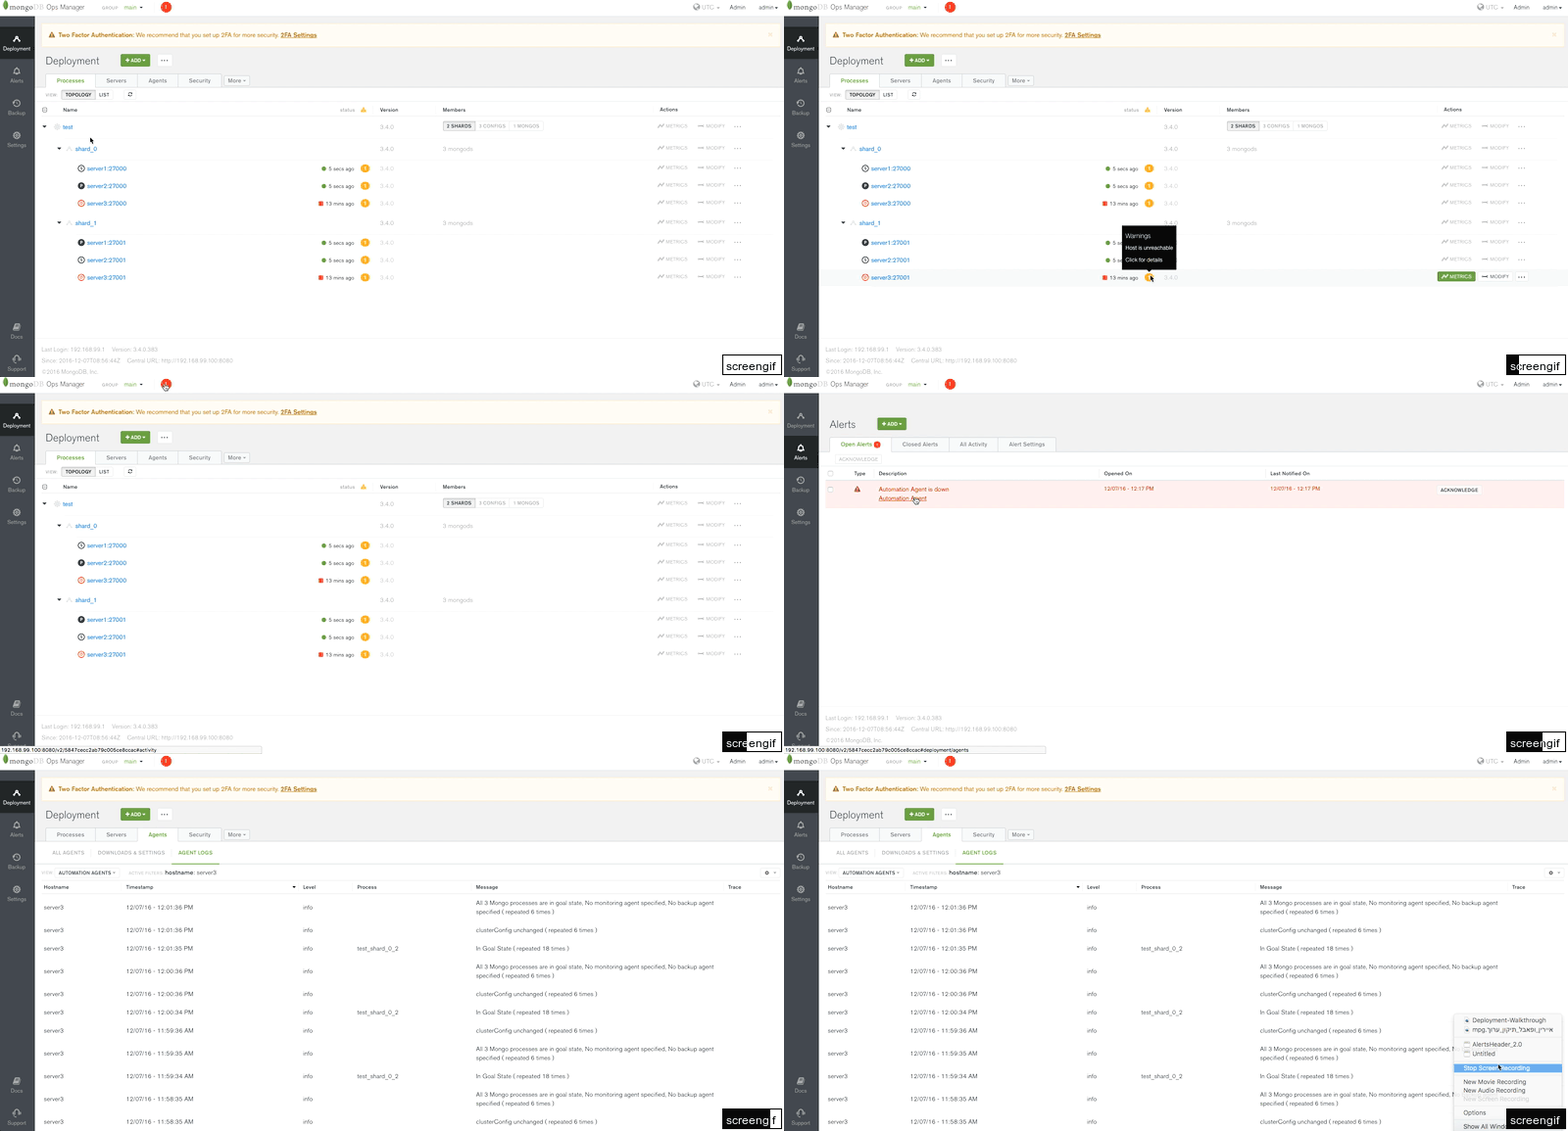
In Ops Manager 3.4, agent health is reported via alerts. These alerts function identically to all other alerts and appear in the Alerts tab. Agent alerts are active by default.
Alert Management
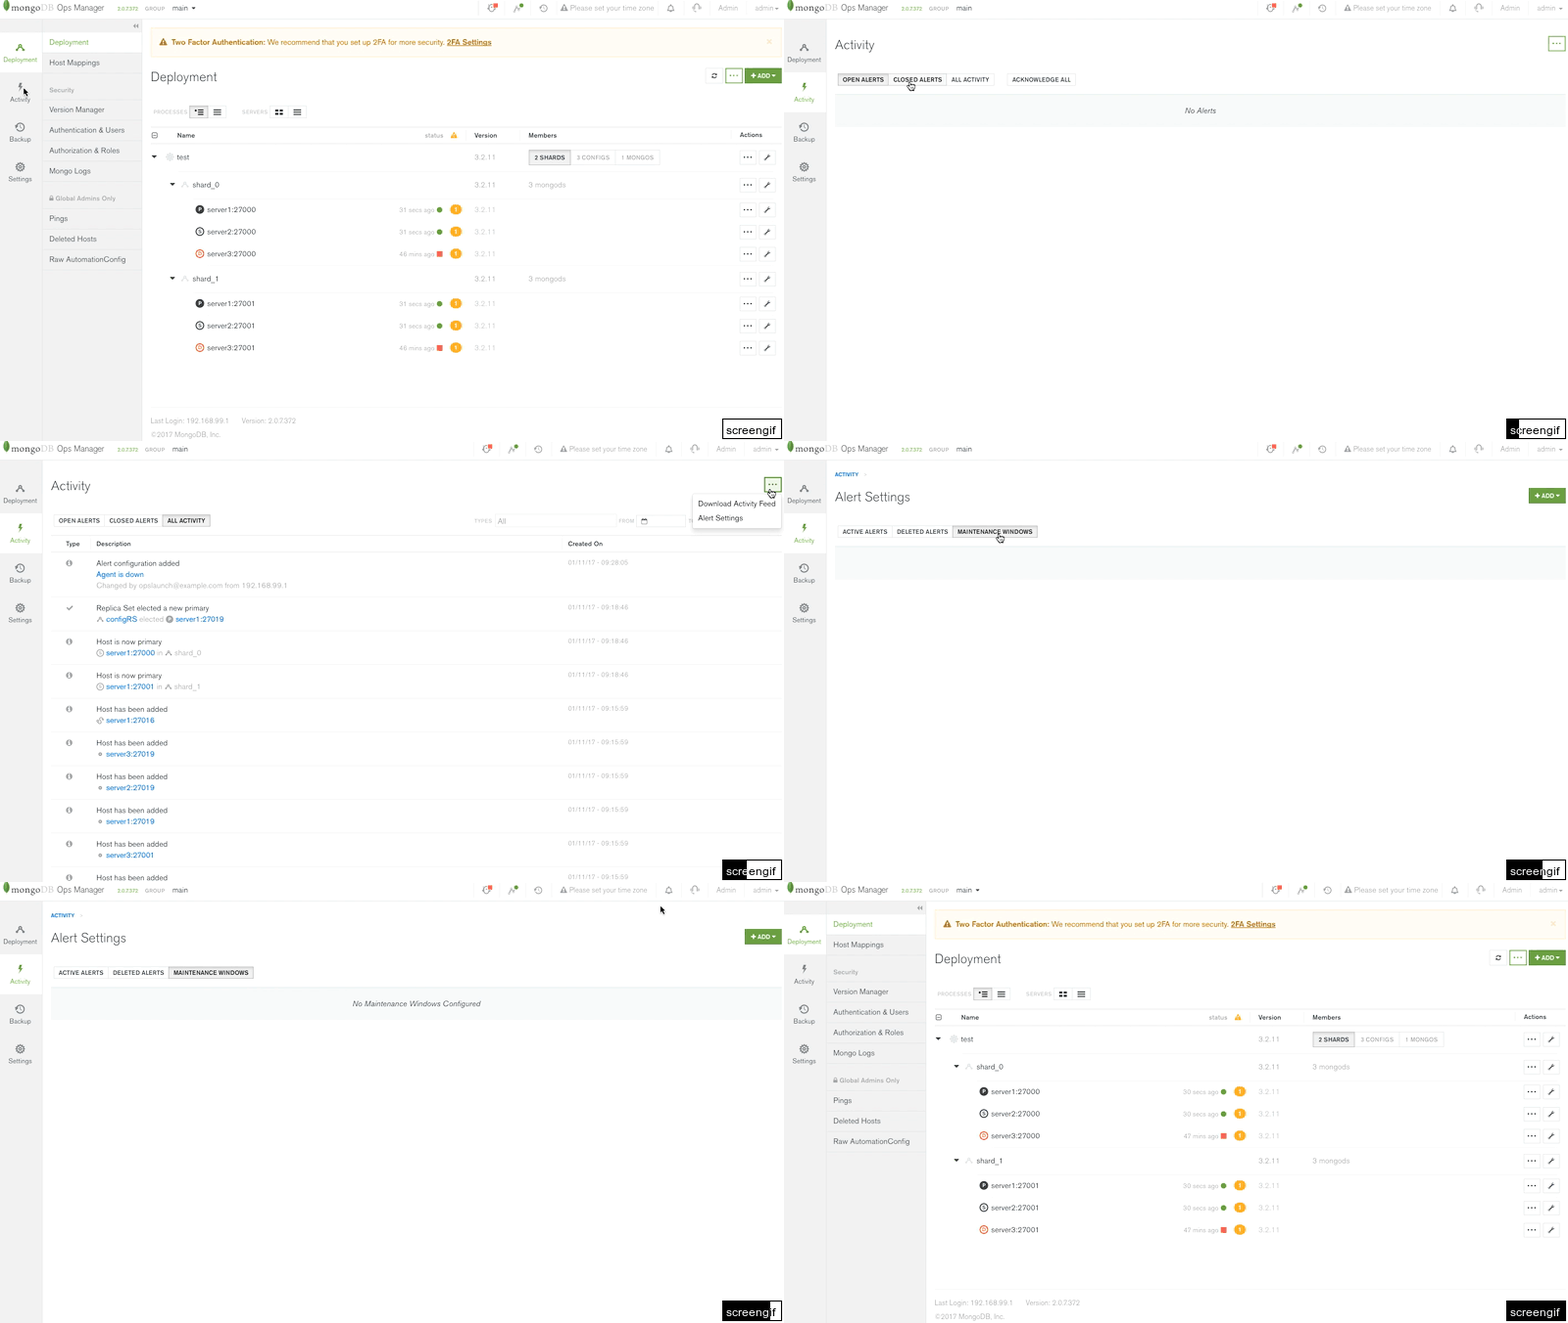
In Ops Manager 2.0, the alert types (OPEN ALERTS, CLOSED ALERTS, ALL ACTIVITY) are selected using buttons. The alert settings page is accessed via the ellipsis button in the upper right-hand corner of the page. The settings page contains the ADD button, via which new alerts are created.
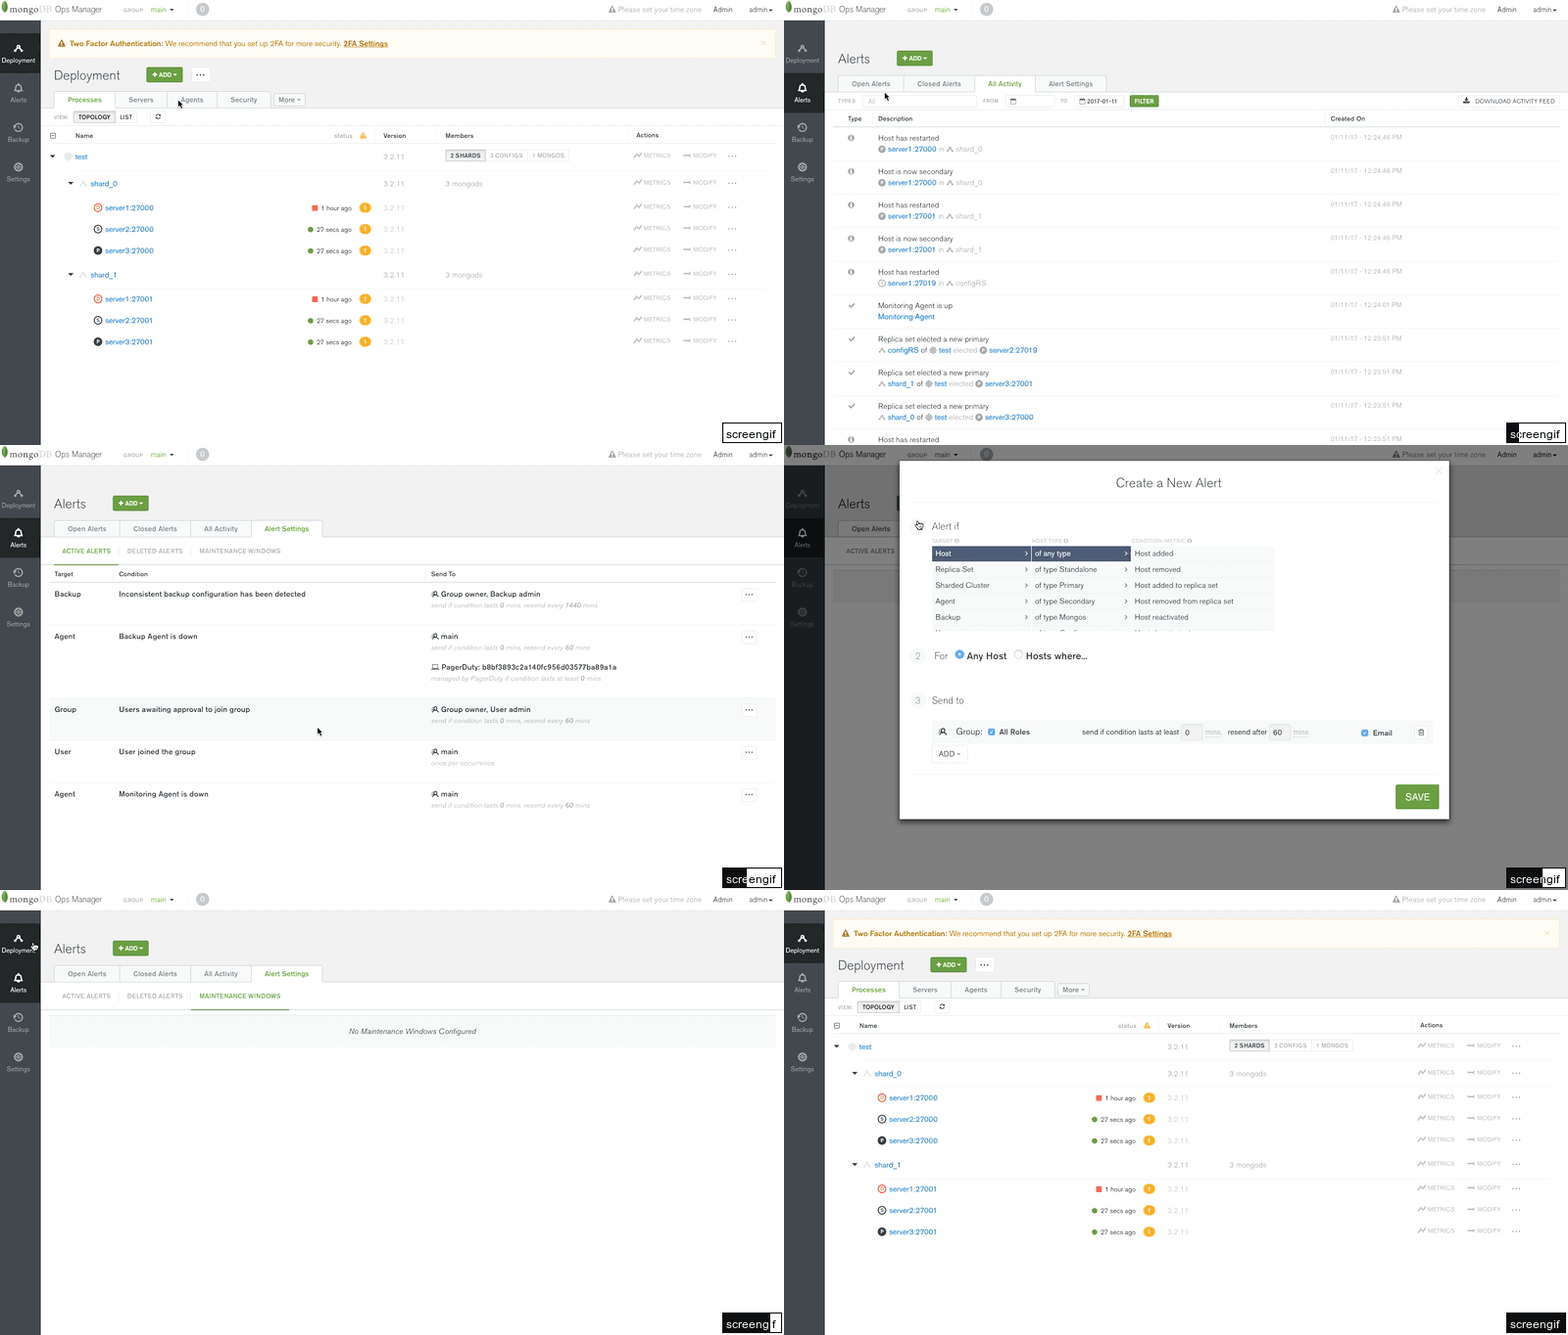
In Ops Manager 3.4, the alert types have become tabs. In addition to the 3 alert types, alert settings have been moved to a fourth tab, Alert Settings. The ADD button is now on the main alerts page, right above the tabs.
Metrics
In Ops Manager 2.0, metric chart zoom and granularity are set via buttons. "Last Ping" information is accessed via the ellipsis button.
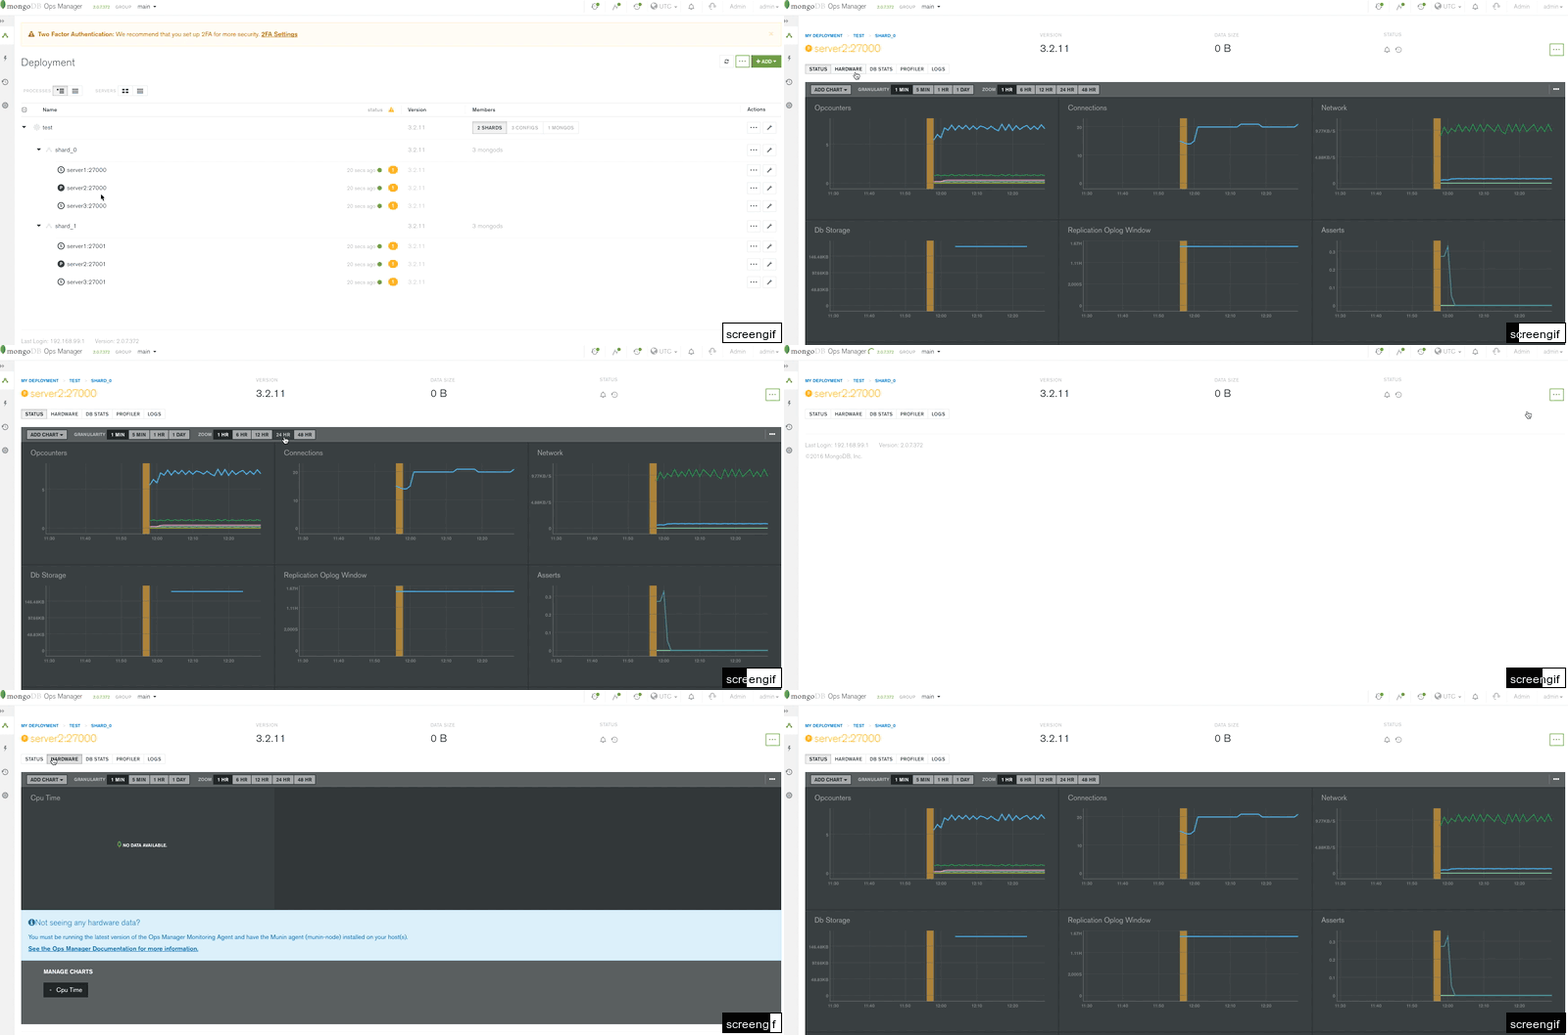
In Ops Manager 3.4, zoom and granularity were changed to drop-down menus, and an additional 10-second granularity setting was added for improved resolution. The granularity drop-down also has a new "auto" setting which chooses the optimum granularity based on the display period. "Last Ping" information is now listed under More. For HW metrics, use of munin-node is no longer required. HW metrics are automatically gathered for automated deployments.
Documentation and Support
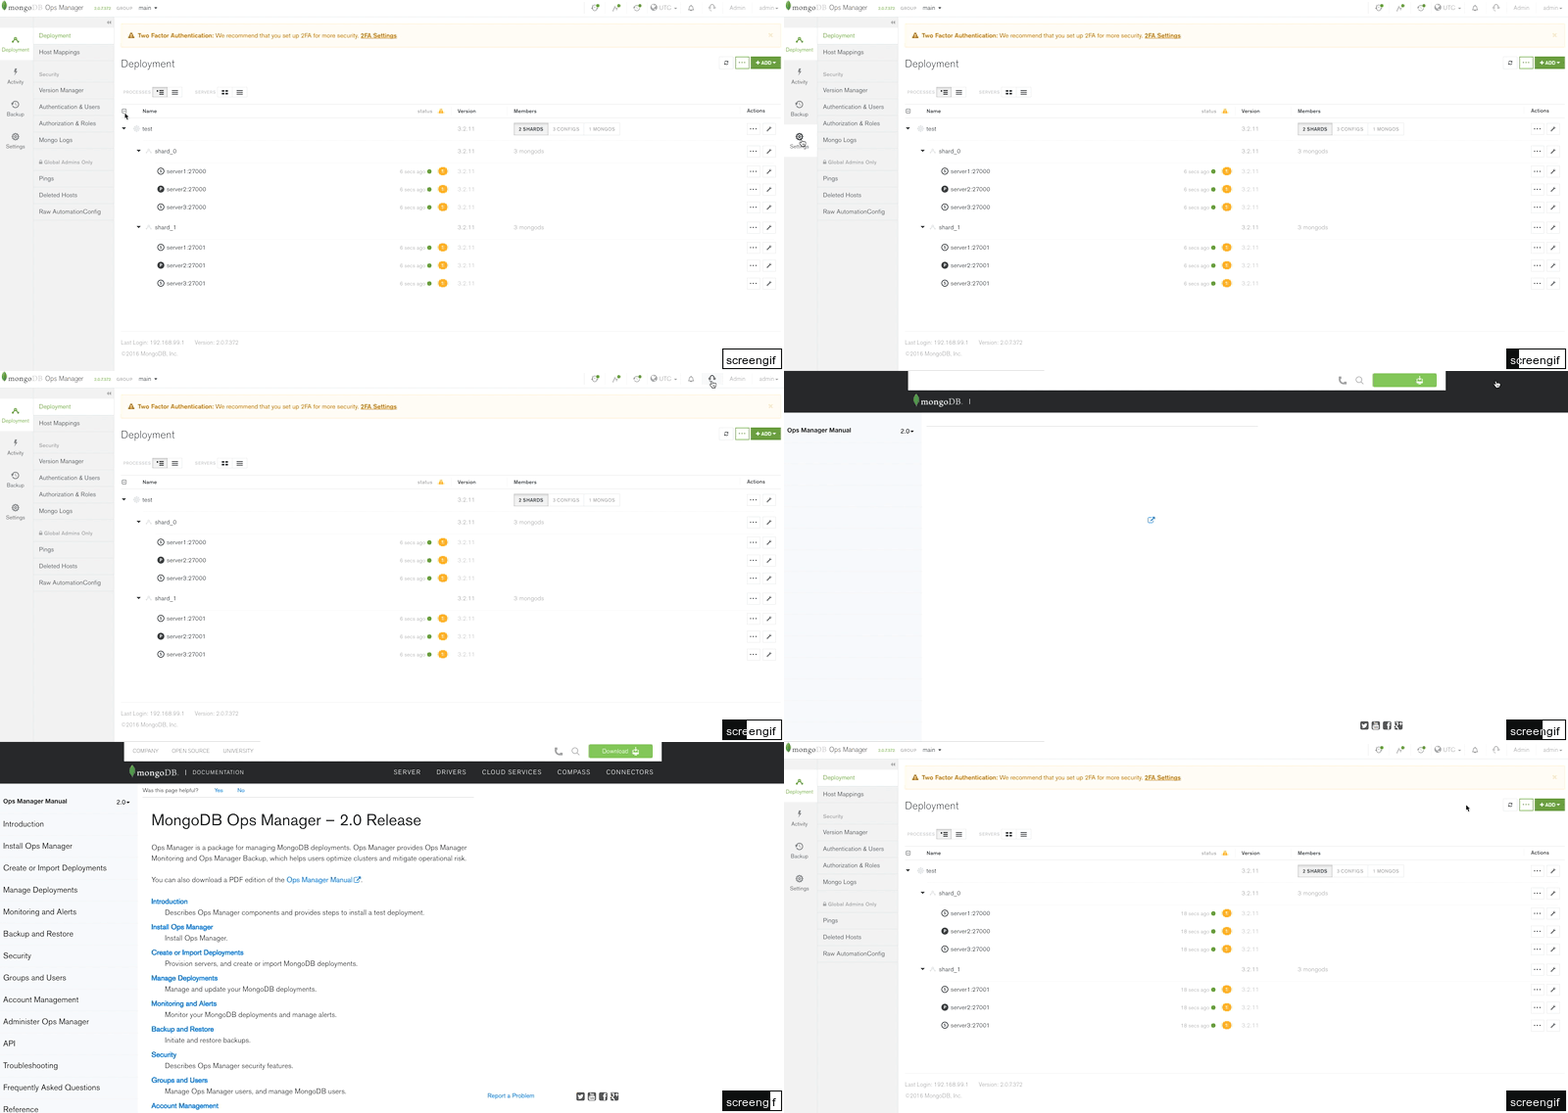
For Ops Manager 2.0, documentation and support were accessed via icons in the top-right corner of the page.
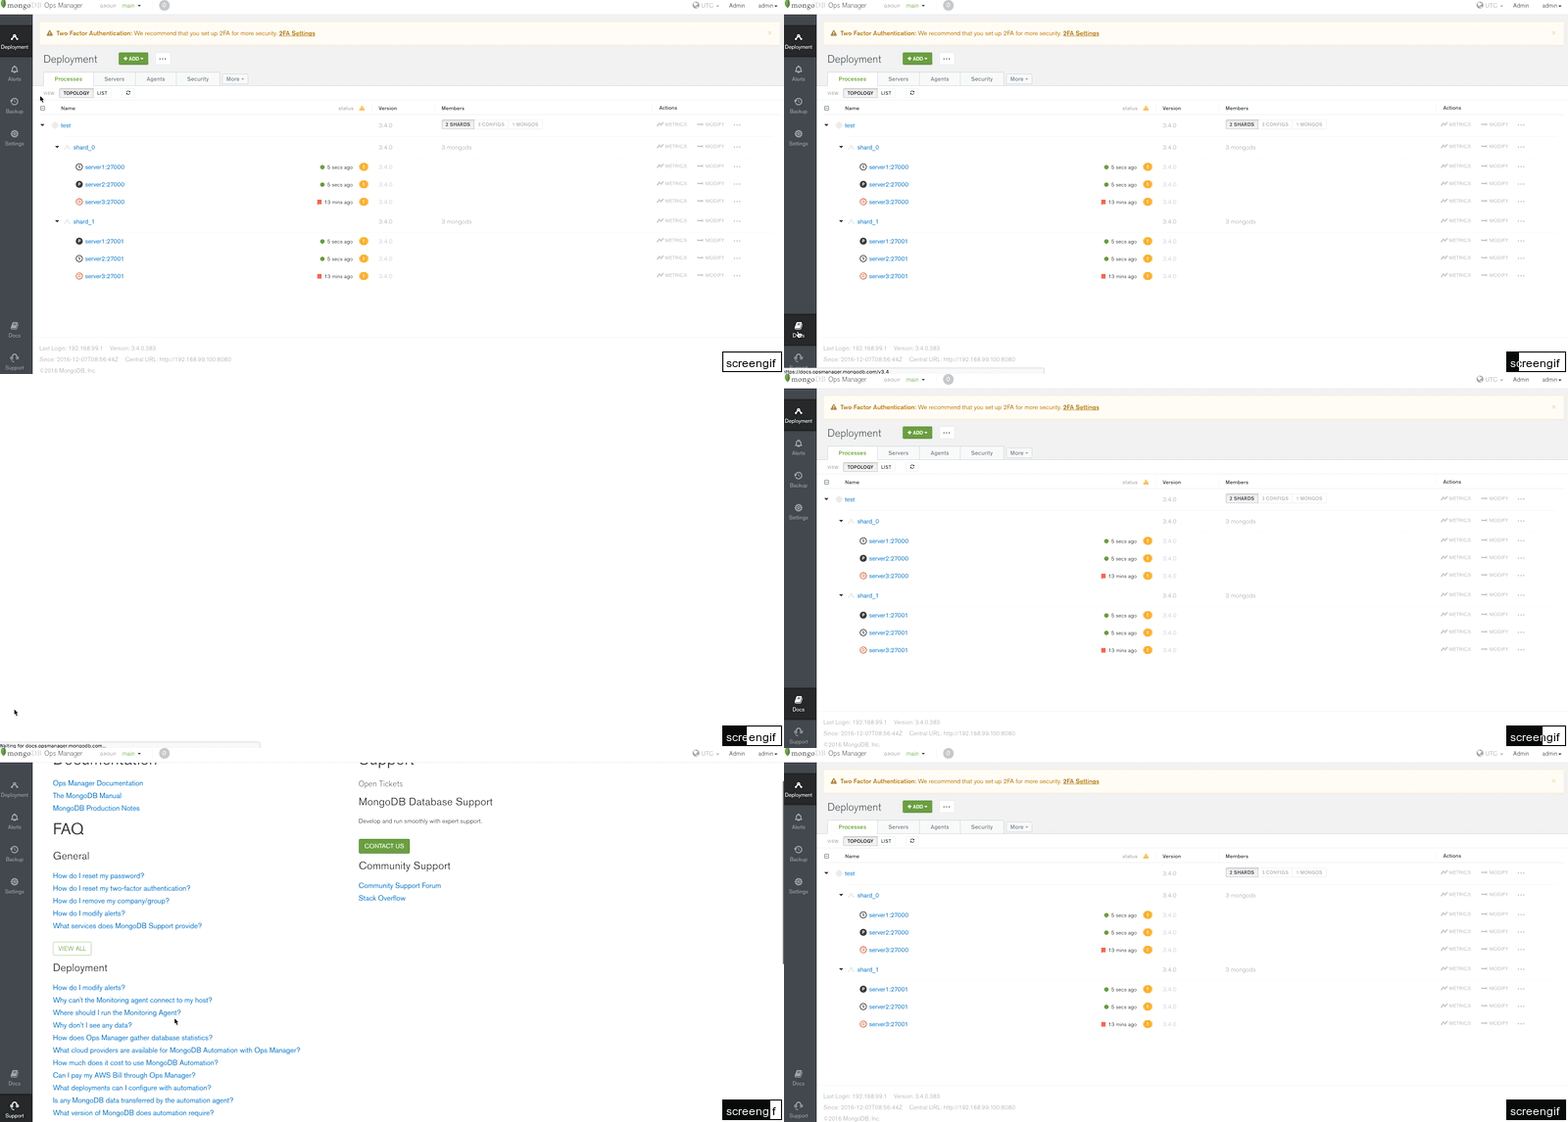
In Ops Manager 3.4, those are accessed via buttons at the bottom of the left-hand navigation bar.
Admin Page
For Ops Manager 3.4, existing functionality on the Admin page remains identical to version 2.0. This page is also the location for accessing two new features: S3 blockstore configuration for backups (under the existing Backup button) and server pool administration (under the new Server Pool button). For more details on these features, see the Ops Manager documentation.
Learn more about MongoDB Ops Manager 3.4.
About the Authors
Pavel Duchovny and Eric Sommer are Technical Services Engineers in MongoDB's Tel Aviv office. You can learn more about MongoDB Technical Support at https://docs.mongodb.com/manual/support.
-b5607eqner.gif)