Today, at .local NYC, MongoDB Atlas introduced the new Query Insights tab, enhancing how users monitor, manage, and optimize their database performance directly within the Atlas UI. This new feature offers developers deeper insights into their database’s performance, with a more powerful query analysis tool and detailed namespace-level metrics for faster issue resolution and enhanced performance.
Applications and workloads change over time, making it increasingly difficult to track inefficient queries that strain a database's resources. Metrics can spike for various reasons, and developers need the right tooling to determine the source of the problem so they can quickly identify and resolve the issue. MongoDB Atlas's Query Insights directly tackles these challenges by enhancing MongoDB's observability capabilities with two crucial features: Namespace Insights and an upgraded Query Profiler.
Query Insights delivers performance optimization through actionable intelligence
The introduction of MongoDB Atlas Query Insights demonstrates MongoDB’s commitment to advanced database management. This feature enhances our platform’s observability capabilities with detailed and actionable insights. This feature integrates Namespace Insights and an upgraded Query Profiler within a new dynamic interface, helping boost database performance by streamlining diagnostics and reducing troubleshooting times.
The newly added Namespace Insights provides users with collection-level latency statistics and a comprehensive view of how the hottest collections on a cluster perform over time. This enables developers to answer "Who or what is causing the problem?” which is instrumental in identifying performance trends and prioritizing query optimizations.
The enhanced cluster-centric Query Profiler introduces a more comprehensive view of slow and inefficient queries over a broader period. Having an overall view of data across the entire cluster facilitates more straightforward navigation between nodes and a longer lookback period to identify trends. This ultimately reduces troubleshooting time, thereby enhancing developer productivity and improving overall database performance.
Key benefits of Query Insights
Query Insights brings MongoDB Atlas users several new benefits, including:
-
Granular telemetry: Faster identification and resolution of database issues with namespace-level latency statistics
-
Improved observability: It is easier to spot performance trends, identify root causes, and debug applications
-
Enhanced productivity: Reduced troubleshooting time thanks to a more comprehensive view of slow operations
Try it out!
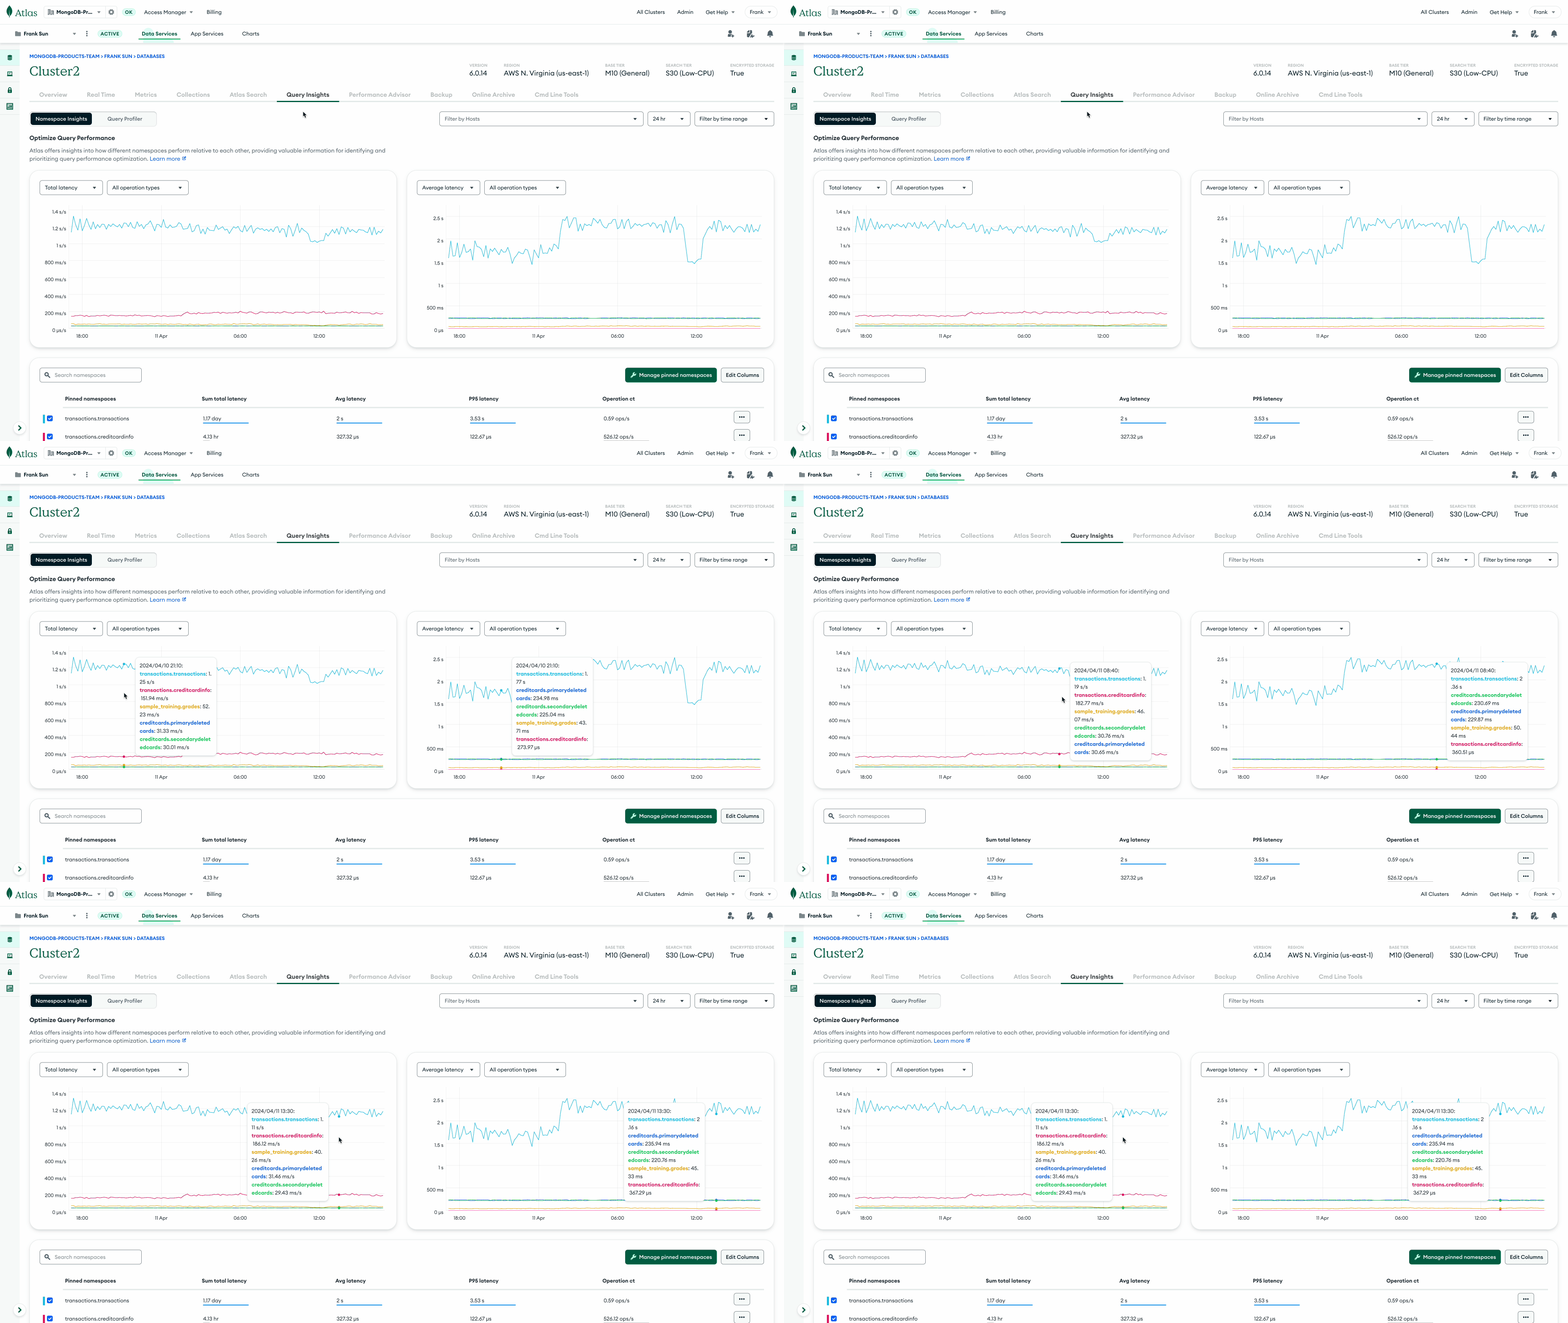
The Query Insights page provides more granular insights into database performance by providing collection and operation-level details. The Namespace Insights page provides metrics for the top 20 collections by total latency.

Hover over the charts to see how collections perform relative to each other over time. This information makes it easier to answer the question: “who/what is causing the problem?”
Use the Query Profiler to view specific slow operations. Click on a point in the scatter plot to bring up additional metadata about each slow operation.
-t725ylsa5x.gif)
Click on View More Details to see more metrics and metadata about each slow operation, including the app name, the operation, the plan summary, execution stats, etc.
Empowering users for peak performance
The launch of Query Insights in MongoDB Atlas underscores MongoDB’s commitment to enhancing our platform's observability capabilities. By providing users with the necessary tools and insights for optimal database performance, MongoDB enables developers to spend less time debugging and more time creating—lowering the total cost of ownership and maximizing efficiency, adding significant value to our users' operations.
Sign up for MongoDB Atlas, our cloud database service, to see Query Insights in action, and for more information, see Monitor Query Performance.