If you’re a developer who loves working with GUIs, you have probably used MongoDB Compass, MongoDB’s official GUI, to view and manage your data, build aggregation pipelines, and more.
We’re always adding and improving Compass features to better support your experience. In line with this, we recently added highly-requested settings to Compass to enable more customization and boost developer productivity. In this blog, we’ll be running through the settings that are most helpful to leverage depending on your use case.
One-and-done settings
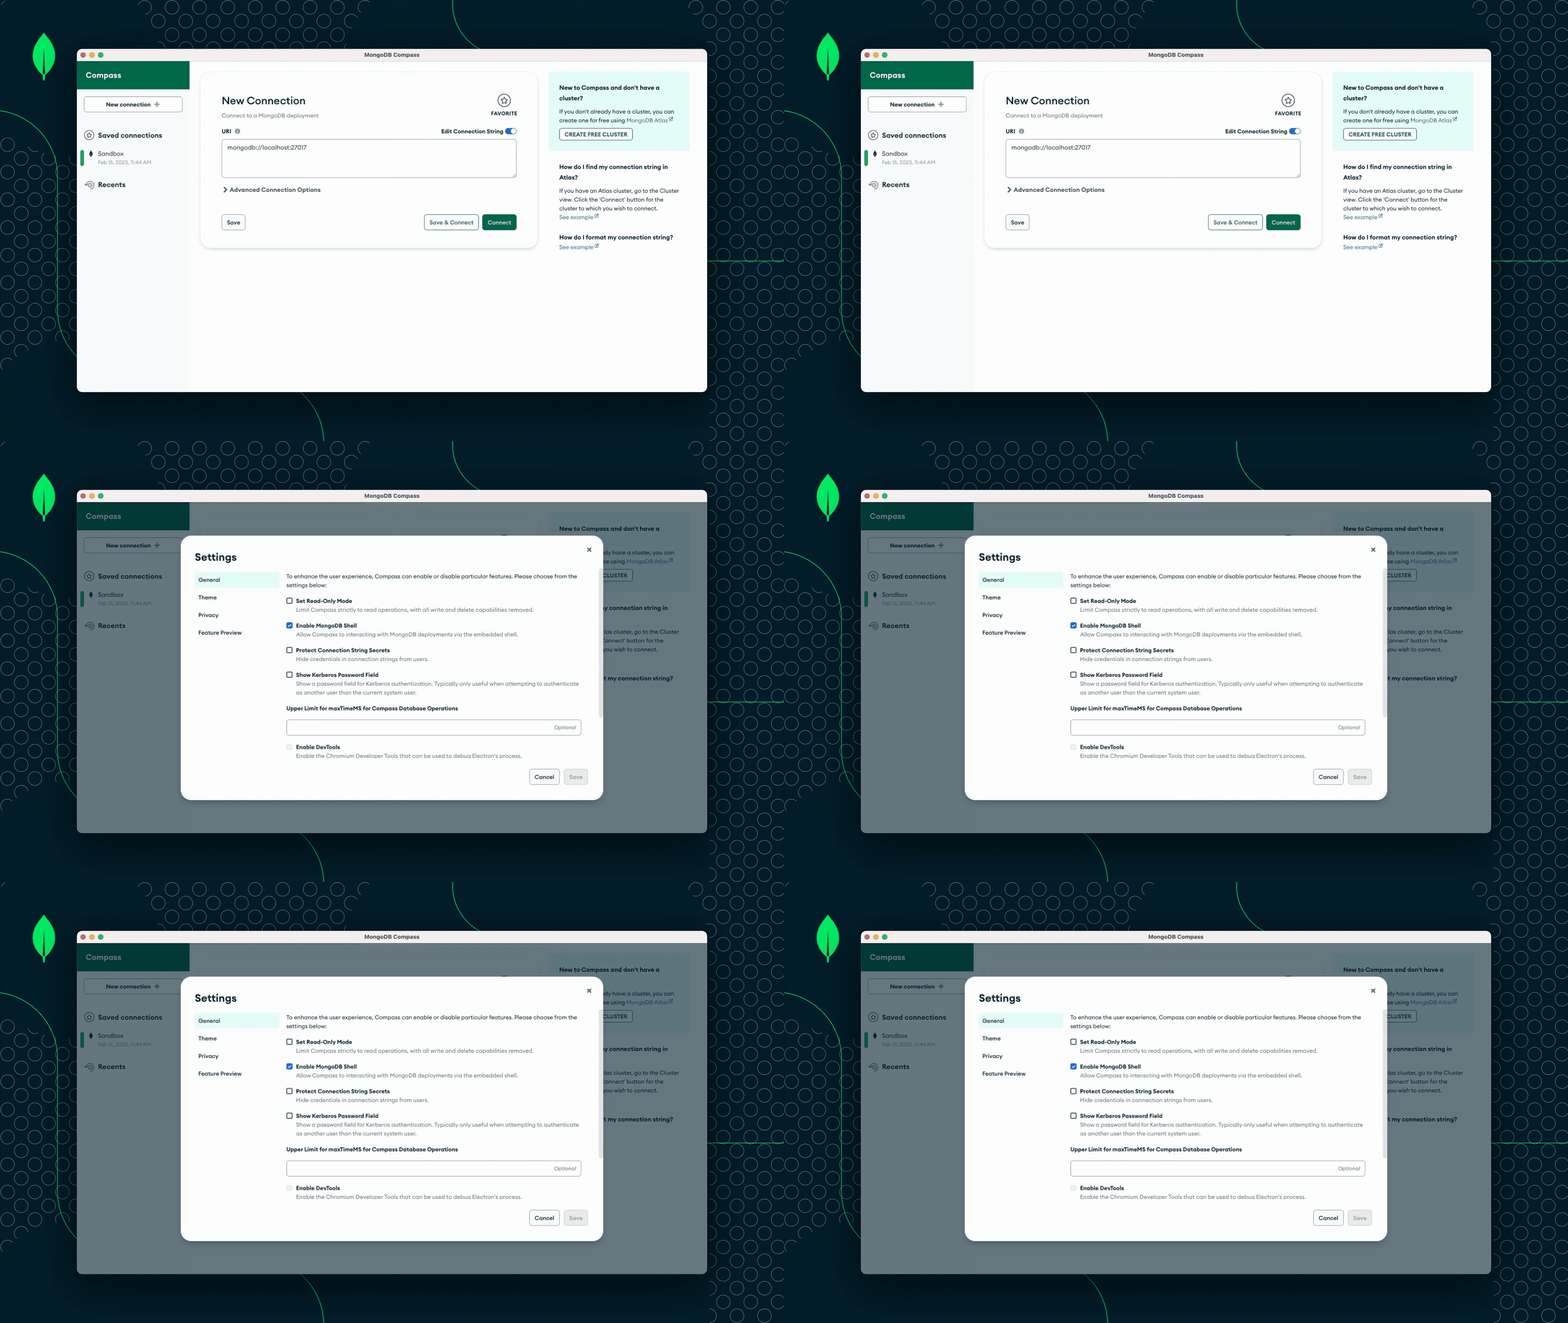
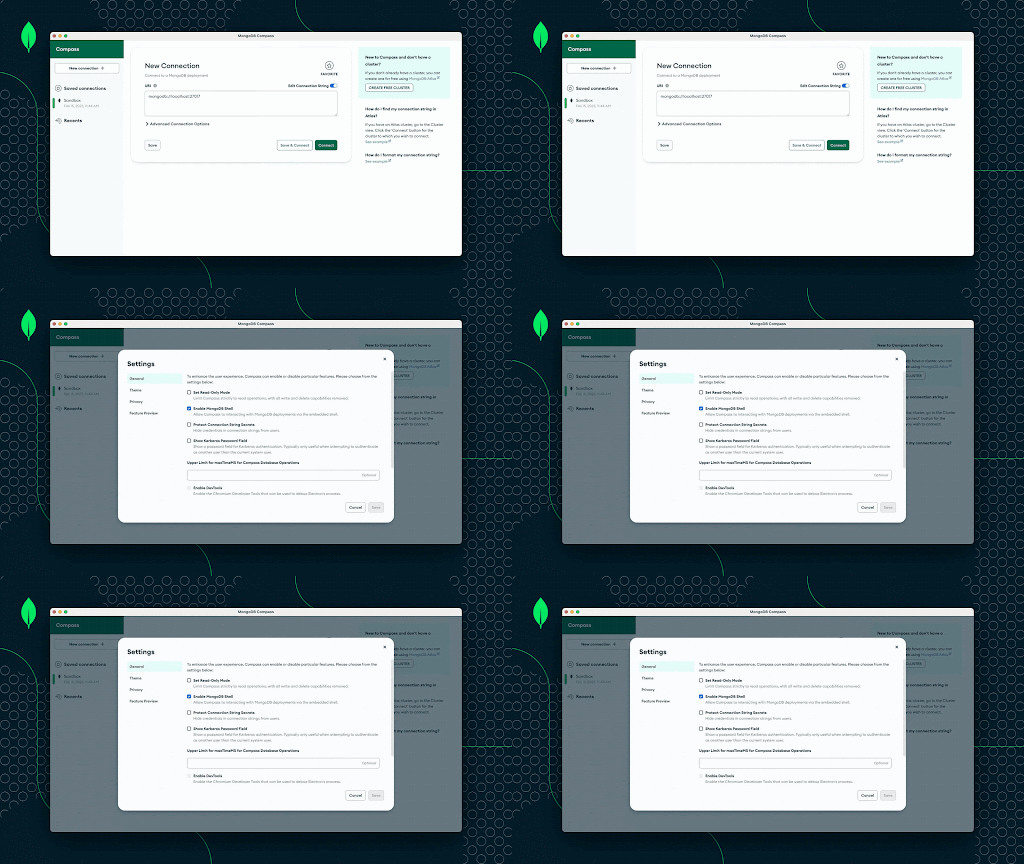
The settings modal is the central location where you can manage the majority of your Compass settings. The settings here are ones that you can quickly enable and leave on unless your preferences change later on. If you’re a Mac user, you can open the settings modal using the ⌘, shortcut or by navigating to “MongoDB Compass” -> “Settings”. If you’re a Windows user, you can use the Ctrl + , shortcut or navigate to “Connect” -> “Settings”.

Dark theme
Prior to its release, dark mode was the feature customers requested the most for Compass on our product feedback forum. We’re excited to have delivered this feature last year by adding a dark theme in Compass and the option to sync your Compass theme with your OS settings under the theme tab under “Settings.” More recently, we’ve updated our dark theme to have clearer contrast and look and feel more modern. Dark theme should additionally help preserve your battery life and reduce visual strain.
Feature preview
Under “Feature Preview,” you can enable new features of Compass before they’re generally available. Enabling the settings listed here can be a great way to try out helpful and sleek features early on. If you have feedback on any of the features here or additional requests, you can submit them in our feedback forum.
General settings
Other global settings can be found under “General.”
Consider a scenario where you’re working with production data. Your workflow could work like this:
- You may not want to accidentally write to the database, so you can enable “Set Read-Only Mode” to restrict yourself to read operations for the time being.
- After noticing a bug in production, you search for a single document on a large collection in the Documents tab. Before running the query, you may want to reduce the maximum query time to be less than the default 60 seconds to reduce risk on this production workload.
- If this is a one-off query, you can set MaxTimeMS under “More Options” in the query bar for this query. The MaxTimeMS that you set will be in effect until you reset the query bar.
- If you envision that you’ll run other complex queries later, you can set the “Upper Limit for maxTimeMS for Compass Database Operations” in the settings modal.

If you want to see other settings that you can leverage, we recommend that you check out “General” and “Privacy” in the settings modal.
Customizing Compass for your use case
Now that we’ve looked at how to optimize settings that apply across the full Compass experience, let’s look at how you can adjust other more specific settings in the course of your daily workflows.
In the Documents tab, there are three options for viewing your data: the default list view, JSON view, and table view. Depending on your previous database experience and the task that you’re working on, you may prefer some of these views to others:
-
When you’re developing your application, the default list view can be helpful for referencing your schema and getting a mental model of your data.
-
When you want to find a specific document for debugging purposes, the default list and JSON views are helpful. They allow you to easily see all of the fields available in a document. If you want to view or edit data types, the default list view is most useful. If you’re looking to make a quick edit and don’t want to worry about setting data types, you can use the JSON view. These views are also helpful for checking out nested values and elements.
-
If you’re used to working with relational databases or want to scan more documents, the table view can be handy.

Once you have selected your view of choice, you may want to search results or compare data from different collections. To do this, you can open the respective collection in a new tab. Similarly, if you want to open another MongoDB environment without closing the one that you have open, you can open a new Compass window using the ⌘N shortcut on Mac and Ctrl + N on Windows. This can be helpful when you want to view the same document(s) or test queries across your local/debugging, staging, and production environments.
To adjust the size of content, you can use the ⌘= and ⌘- accessibility shortcuts for zoom in and zoom out on Mac respectively, or Ctrl + = and Ctrl + - on Windows. Other Compass shortcuts can be found in our documentation here.
Aggregation settings
There are aggregation-specific settings that you can leverage when you’re building pipelines in the Aggregations tab:
-
If you’re familiar with aggregation syntax and don’t want to see helper text when adding new stages to your pipeline, you can disable comment mode.
-
If you want to see more than 10 documents in the preview of documents, you can set the number of documents shown in the preview to a higher count.
-
Let’s say that you’re building a long and complex aggregation and want to reduce the amount of time that it takes to preview the results of the pipeline that you’re building. You can reduce the number of documents sampled for the document preview. Note that this setting is only applied for the document preview and is not applied when the pipeline is run.

What's next?
We hope the info in this blog helps you get even more out of your experience with MongoDB Compass. We’re continually improving our Compass settings experience - if you have any Compass settings or other Compass feature requests, you can submit them in our feedback portal.