MongoDB Atlas and DataDog work better together to enable you to take advantage of the automation, elasticity, and scalability of modern infrastructure and act on real-time information to make well-informed decisions.
With the latest release of MongoDB’s DataDog integration, we’ve added the ability to send custom defined labels in Atlas, CM, and OM to tags on the DataDog metrics object. Applying tags to DataDog's metrics allows users to organize and categorize their metrics in various ways.
Here's how the new DataDog metrics tagging works:
-
Define key-value labels in MongoDB at the cluster level that get automatically sent to DataDog as metrics tags. You can define tags based on the attributes you want to track and then assign those tags to the relevant metrics. For example, a tag named "region" could be assigned to metrics representing servers in different geographic regions.
-
Filter and group metrics in DataDog by tags. You can then use these tags to filter, group, and aggregate metrics in various ways. For example, you can group metrics by tags such as "application," "environment," or "owner" to gain insights into how different parts of your infrastructure are performing. You can also filter metrics by tags to view just the metrics you're interested in.
-
Use tags to set alerts and dashboards. You can create alerts and dashboards in DataDog based on tags. This allows you to monitor specific aspects of your infrastructure, such as servers in a particular region or metrics related to a specific application.
DataDog's metric tagging feature is highly flexible and customizable, allowing you to adapt it to your specific organizational needs. Effectively using metrics tagging will grant you a better understanding of your application’s performance and help organizations make data-driven decisions.
Read on to see an example of how MongoDB’s DataDog tagging integration can help organize your metrics and how you can use it to drive your business’ monitoring requirements.
Setting cluster labels in Atlas
In the example below, I’ll use MongoDB’s Data API to access and configure my MongoDB Atlas data. In this case, I’ll use MongoDB’s Data API to set new labels on my MongoDB Atlas clusters. To explore the new MongoDB Data API, you can use the public Postman workspace provided by the MongoDB developer relations team.
You can use the cluster configuration API endpoint to add labels to a cluster in MongoDB.
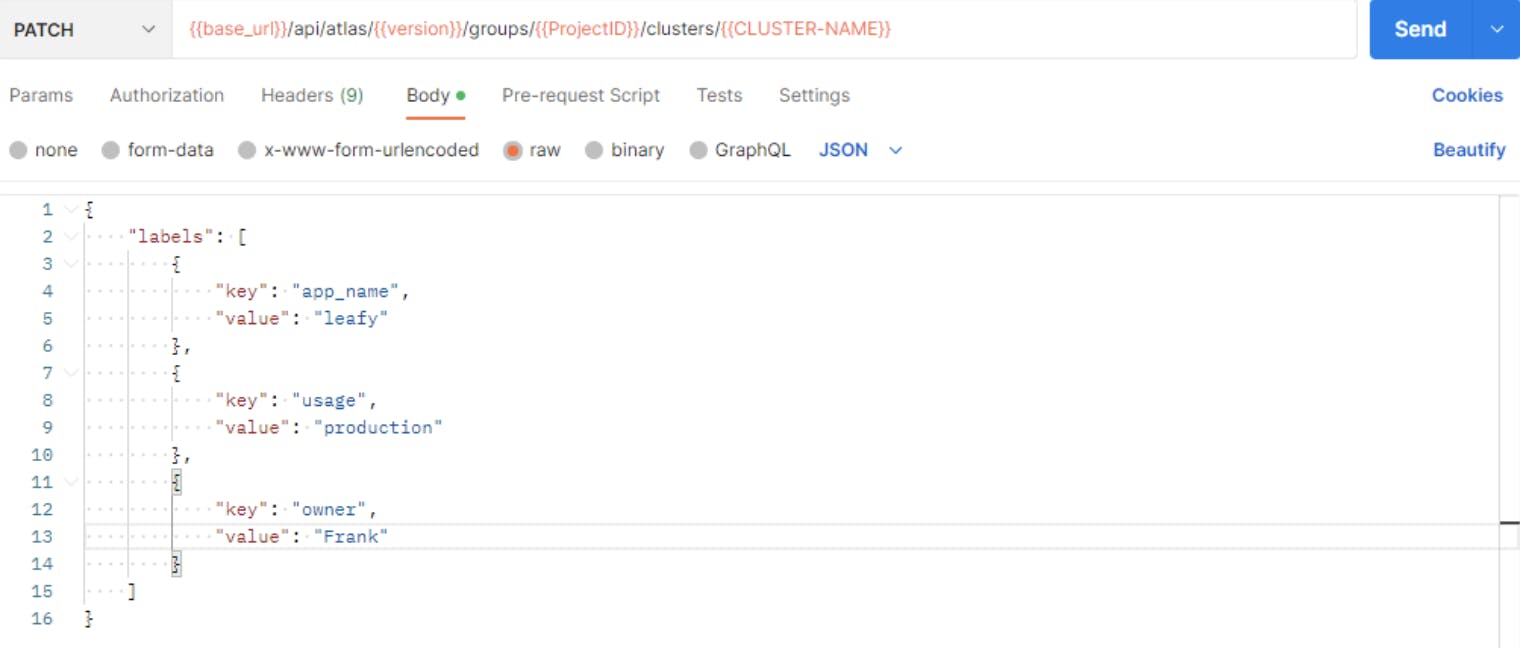
You can then use the get all clusters endpoint to verify that your labels were applied correctly.

Once you’ve labeled your MongoDB clusters, set up your DataDog integration as you would normally. For more information on configuring MongoDB’s DataDog integration, refer to the documentation here.
Using DataDogs metrics tagging to drive business logic
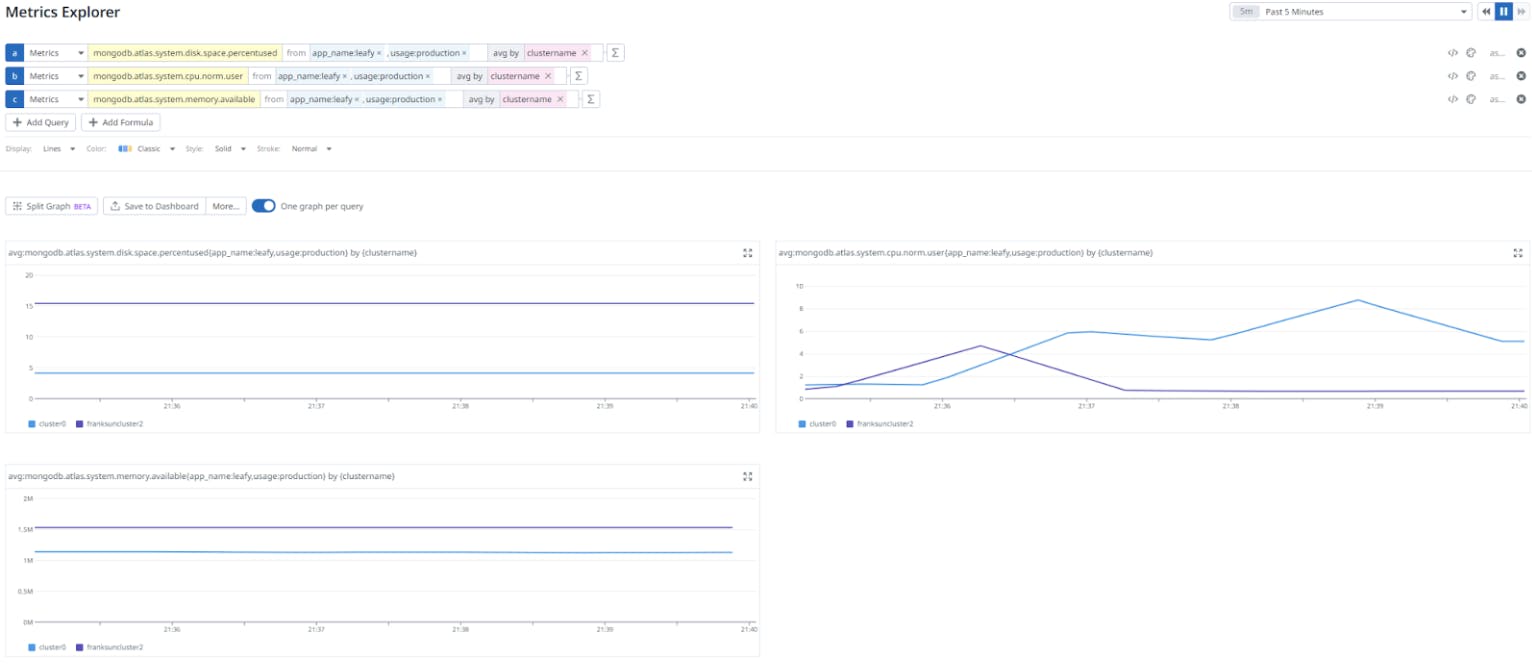
After setting up your DataDog integration, you’ll automatically start seeing the labels you previously defined in MongoDB show up as tags on your DataDog metrics. You can now use these tags to filter, organize, and define logic based on the needs of your business.
As an example, you can filter results in the DataDog Metrics Explorer. If I only want to see metrics for clusters associated with the “leafy” application, I can use tags to filter the metrics I get back.
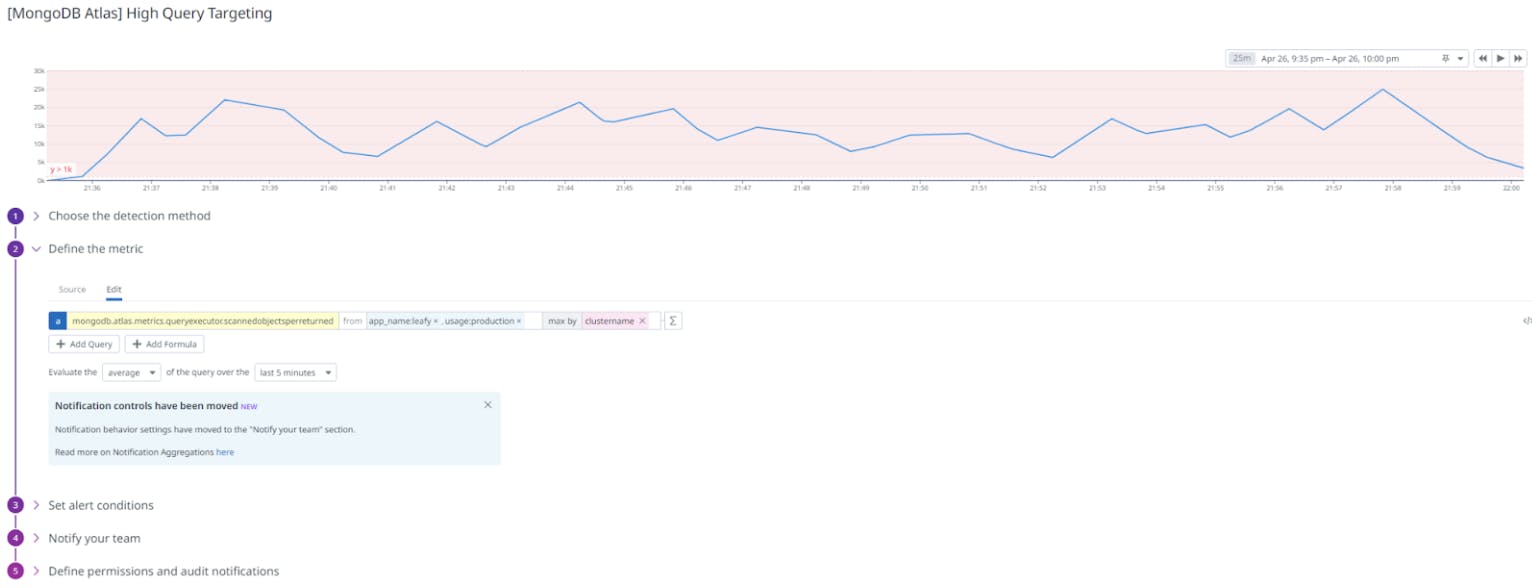
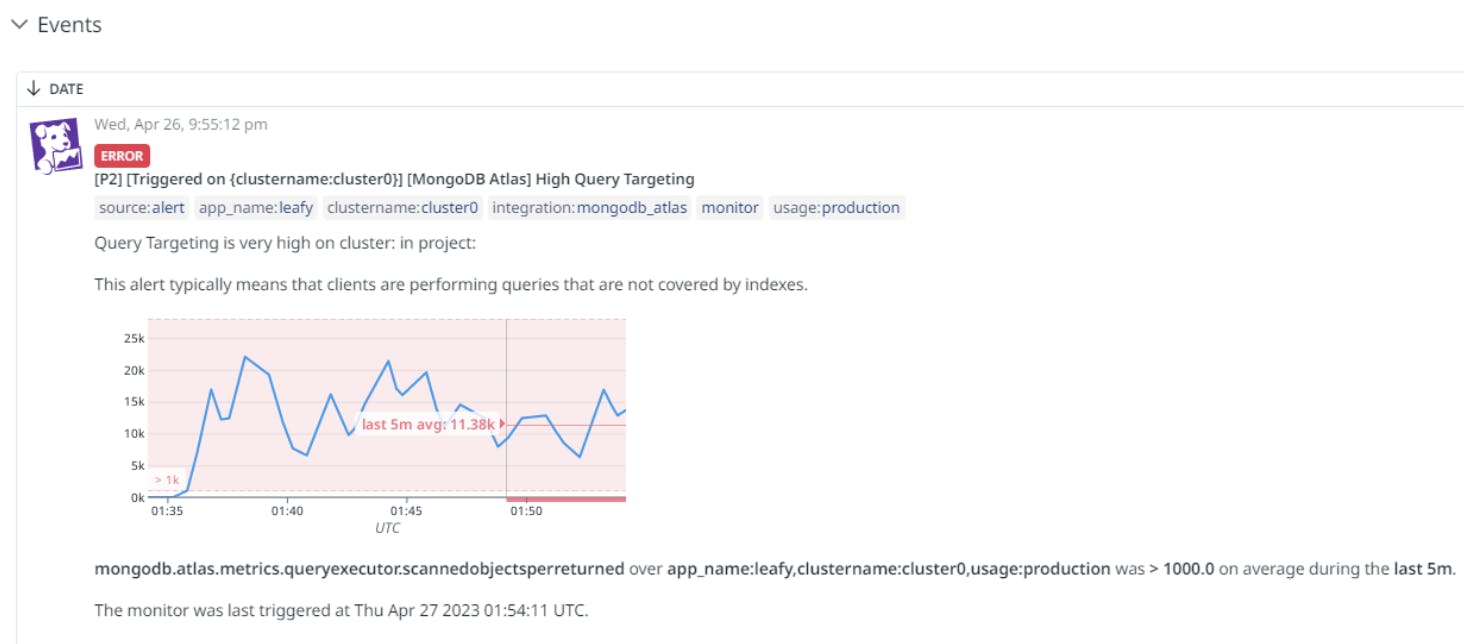
You can also use tags to define custom logic for your DataDog monitors. In this example, I’m configuring monitors to trigger different priority alerts based on the metrics tags. When query targeting exceeds the threshold for production clusters, I’ll get a P2 alert. However, the same alert for non-production environments wouldn’t have the same priority. In this example, I can use the “usage” metrics tag to define different alerting priorities.
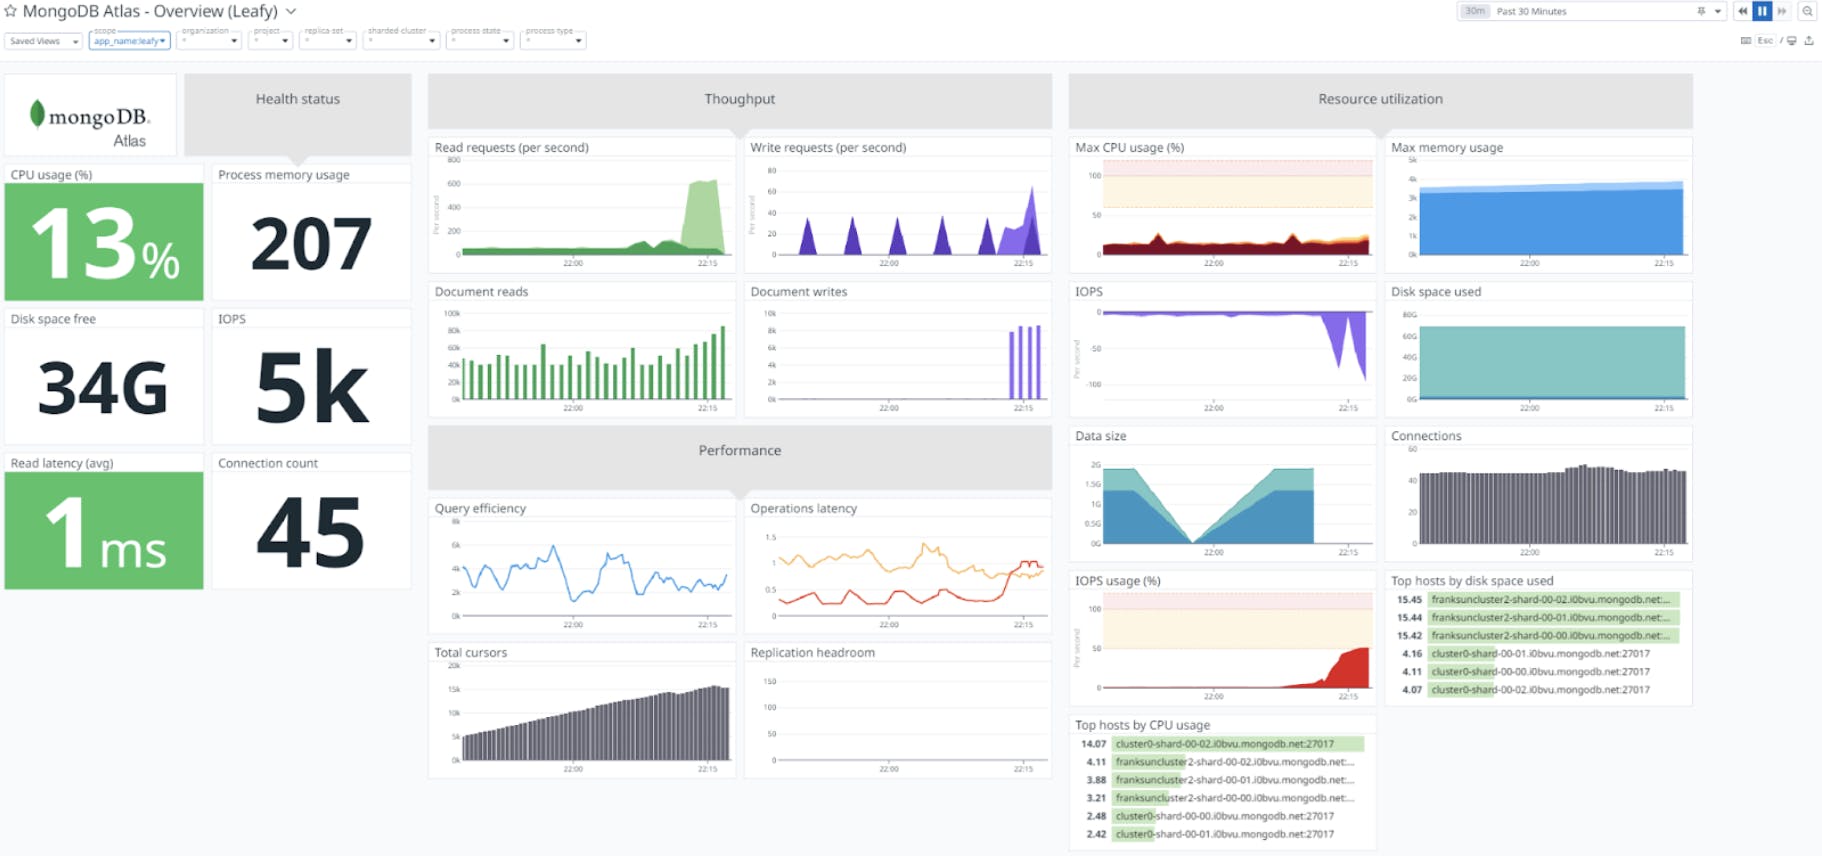
And finally, Datadog metrics tagging can help you organize and filter data in dashboards. Metrics tagging enables you to easily group related data together and create more focused and specific dashboards. For example, you can use the app_name tag here to filter on just the leafy application. This will help you quickly identify and troubleshoot issues. Using tags effectively can grant deeper insights into your data and help your organization make more informed decisions to improve the performance and availability of your applications and infrastructure.
This new enhancement to MongoDB’s DataDog integration provides significantly more flexibility in how you use DataDog and helps you get the most out of your investment. The DataDog integration is available on MongoDB Atlas on M10 cluster tiers and higher.
Learn more about DataDog’s powerful tagging capabilities.
If you’d like to see MongoDB’s DataDog integration in action, the easiest way to get started is to sign up for MongoDB Atlas, our cloud database service.