We're excited to announce Query Library for Atlas Charts!
Getting started with Charts is already fast, easy, and powerful. With Query Library, we have made it even easier to build charts with queries. When you log in to Charts, there are a few essential steps to visualize your data. You need to add a data source, you need to create a dashboard, and from there you can create a chart.
The Charts UI provides a user-friendly, drag and drop interface for building charts. But today, more than a quarter of users also leverage the MongoDB Query Language (MQL) to write custom queries when creating charts.
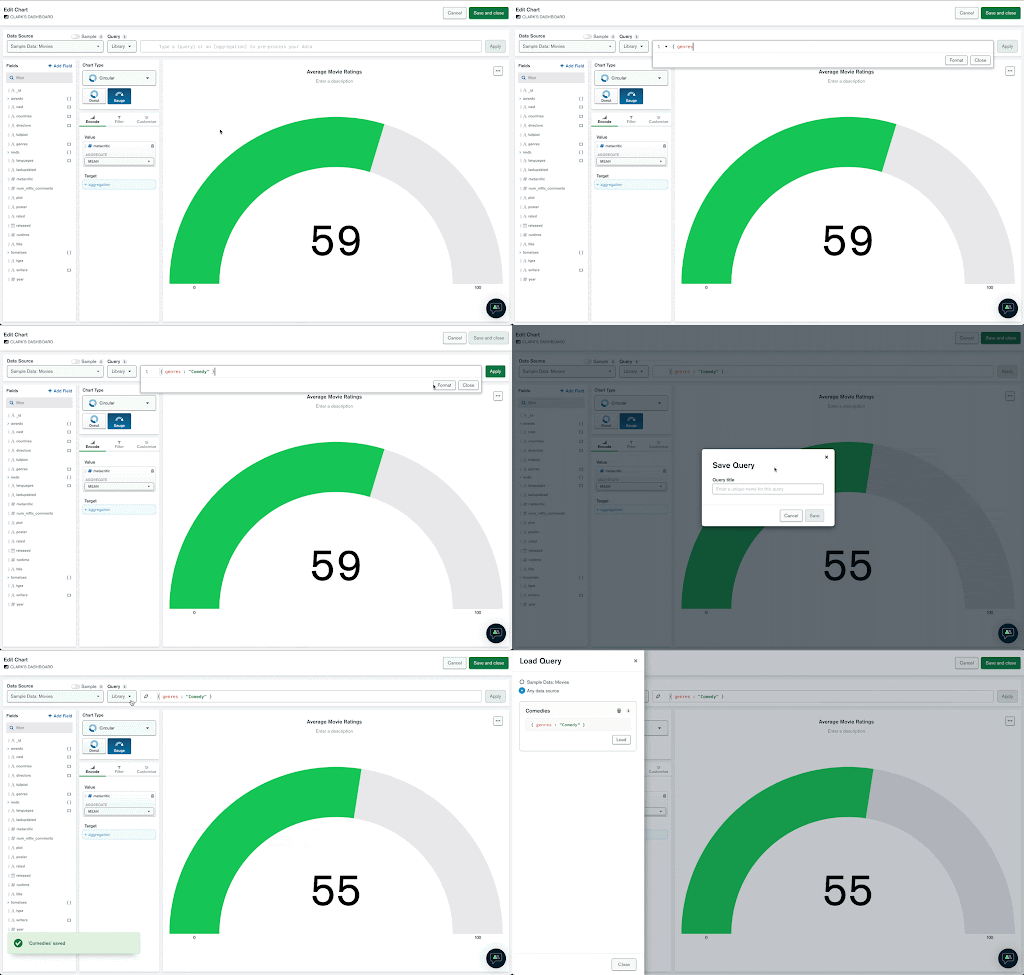
To demonstrate a simple example of what using a query looks like, we’ll use the sample movie data we make available to every Charts user through our sample dashboard. Below we are using MQL to filter for only movies in the comedy genre:
Clik here to view.

Rather than dragging the genre field into this chart and adding a filter, with a little bit of MQL knowledge, a query can speed up the chart-building workflow. As you can see above, users can now also easily save this newly created query or load a previously saved query.
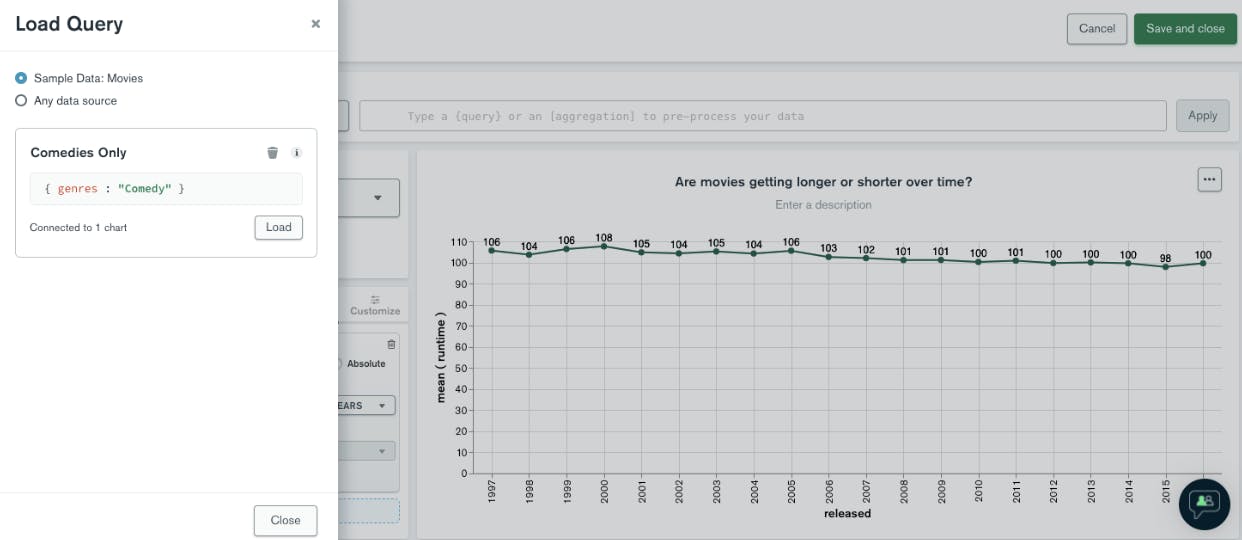
Query Library builds on Charts’ existing support for queries and aggregation pipelines and makes it even more powerful to leverage MQL in building charts. Rather than recreating queries across multiple dashboards, manually sharing with team members, copying and pasting, or otherwise retrieving queries written in the past, Charts users can either save any new query for later use or load a saved query directly from the chart builder. Here’s what it looks like to load a saved query:
Clik here to view.

Best of all, these saved queries are available across your team. Any saved query is available to all members of your project. Check out our documentation for more details on saving, loading, and managing queries in Charts.
Simplifying visualization of your Atlas data
The goal of Atlas Charts is to create a data visualization experience native to MongoDB Atlas customers. It’s a quick, straightforward, and powerful tool to help you make business decisions and perform analytics on your applications. Capabilities like Query Library will help to speed up your data visualization workflow to get you quickly in and out of your data and back to what matters for your team.
To get started with Query Library today, navigate to the chart builder in any of your dashboards, simply write a query, and save it for later use!
Clik here to view.

New to Atlas Charts? Get started today by logging into or signing up for MongoDB Atlas, deploying or selecting a cluster, and activating Charts for free.
