Amazon Managed Grafana is a fully managed service that is based on open source Grafana. Amazon Managed Grafana makes it easy to visualize and analyze operational data at scale. With Amazon Managed Grafana, organizations can analyze data stored in MongoDB Atlas without having to provision servers, configure or update software, or do the heavy lifting involved in securing and scaling Grafana in production.
Connecting MongoDB Atlas to AMG
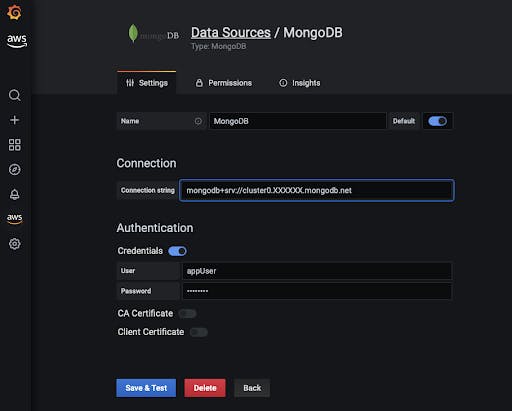
The MongoDB Grafana plug-in makes it easy to query MongoDB with Amazon Managed Grafana. Simply select MongoDB as a data source, then connect to theMongoDB cluster using an Atlas connection string and proper authentication credentials (see Figure 1).
Clik here to view.

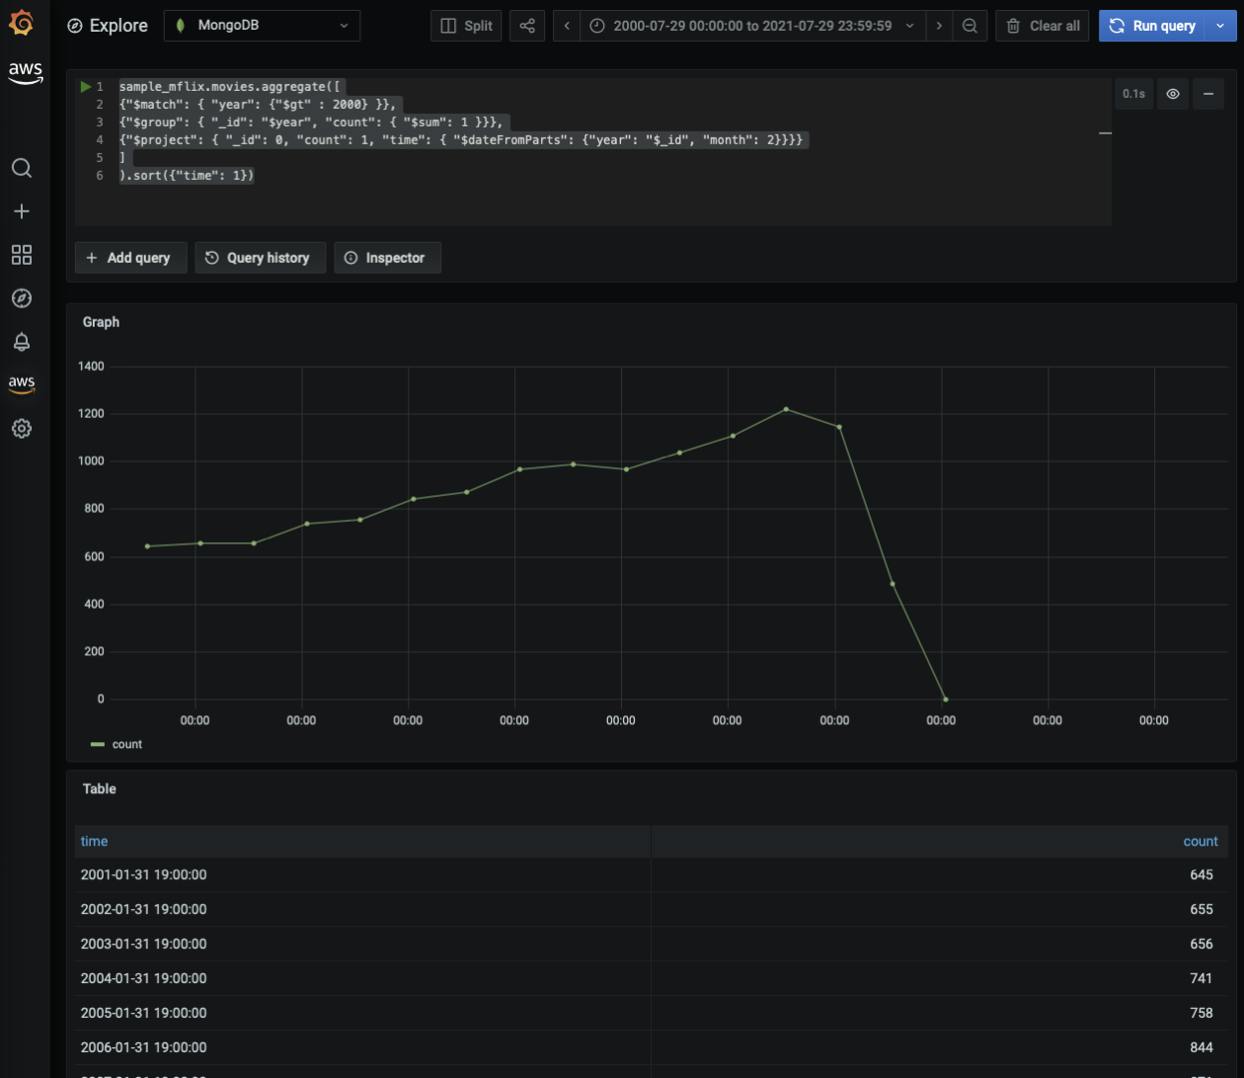
Now, MongoDB is configured as a data source. To visualize the data through Amazon Managed Grafana, select the Explore tab in the side panel and ensure that MongoDB is selected as the data source. Users can then write the first query in the query editor (see Figure 2).
sample_mflix.movies.aggregate([
{"$match": { "year": {"$gt" : 2000} }},
{"$group": { "_id": "$year", "count": { "$sum": 1 }}},
{"$project": { "_id": 0, "count": 1, "time": { "$dateFromParts": {"year": "$_id", "month": 2}}}}
]
).sort({"time": 1})
Grafana will graph the query, illustrating how certain fields change over time. For more granular detail, users can review the data view below the visualization. (see Figure 3).
Clik here to view.

Using MongoDB as a data source in Amazon Managed Grafana allows users to easily analyze MongoDB data alongside other data sources, affording a singular point of reference for all of the most important data in an application. There’s no hassle; once connected to MongoDB from Amazon Managed Grafana, it simply works.
Try out MongoDB Atlas with Amazon Managed Grafana today.
