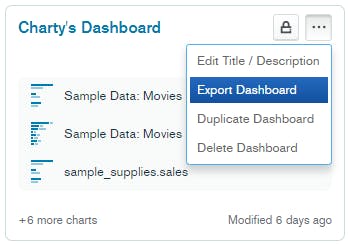
With the latest release of MongoDB Charts, we’ve added the ability to export any dashboard to a file, as well as import those files back into a Charts project. To export a dashboard, simply choose Export Dashboard from the dashboard’s tile on the main Dashboards page.

To Import a dashboard, choose the command from the menu next to Add Dashboard.

Let’s look at some things you can do with this new capability.
Copy dashboards between projects
MongoDB Cloud allows you to create multiple projects, each of which has its own Atlas cluster. There are a bunch of reasons to use multiple projects, but one common example is to use them for different environments of an application, such as Development, QA or Production.
Each Charts dashboard also lives within a project, and up until now there was no way of moving or copying a dashboard between projects. This could be problematic if a dashboard that was created in the Development project needed to be promoted to QA or Production. WIth the new Import/Export feature, you can simply export a dashboard from one project and import it into another.
Version control your dashboards
Taking this example one step further, now that you can export your dashboards to a file, you can treat them as code. That allows you to store the dashboard definitions in a source control system, making it easy to track changes, go back to specific versions, and keep the dashboards stored safely alongside other code artefacts used in your solution.
Share dashboards with the community
While some dashboards only make sense when connected to your own private data, others may be built on a commonly-available schema, whether that’s the Atlas sample data, some open data from the web, or data created by a reusable script. Once you’ve built a great dashboard using this generally available data, why not export it and share it with the world?
Copy dashboards and change their data sources
Whenever you import a dashboard from a file, Charts will give you the opportunity to “remap” the data sources used on the dashboard. This is important because the data in the new project might not match what was in the original project. You can use this feature to your advantage if you want to quickly change the data sources used on a dashboard, even if you are importing back into the same project.
As an example, suppose you are a multinational company and used a different collection to track sales in each country you operate in. You could build a dashboard with a bunch of great charts, all linked to your “US Sales” collection. If you wanted to easily build an equivalent dashboard for your Australian sales, you could simply export the US dashboard, reimport it and remap your data sources on import to the “Australian Sales” collection.
Migrate from Charts on-prem
Finally, this feature provides a great option for Charts on-prem users who want to move to the cloud and take advantage of all of the new features only available to cloud users. While the on-prem version of Charts does not have the Export feature, on-prem users can contact MongoDB Support to obtain a script that will generate export files for on-prem dashboards. Those files can then be imported into your MongoDB Cloud projects using the new Import feature.
We hope you’re as excited about this feature as we are! Remember, if you haven’t used Charts before, you can get started for free by signing up for MongoDB Cloud, deploying an Atlas cluster and activating Charts.